HOT TOPICS LIST
- MACD
- Fibonacci
- RSI
- Gann
- ADXR
- Stochastics
- Volume
- Triangles
- Futures
- Cycles
- Volatility
- ZIGZAG
- MESA
- Retracement
- Aroon
INDICATORS LIST
LIST OF TOPICS
PRINT THIS ARTICLE
by Koos van der Merwe
An inverted head & shoulders pattern at a top is unusual. Does it suggest a buy?
Position: Accumulate
Koos van der Merwe
Has been a technical analyst since 1969, and has worked as a futures and options trader with First Financial Futures in Johannesburg, South Africa.
PRINT THIS ARTICLE
HEAD & SHOULDERS
Is Goldman Sachs A Buy?
08/27/14 03:48:53 PMby Koos van der Merwe
An inverted head & shoulders pattern at a top is unusual. Does it suggest a buy?
Position: Accumulate
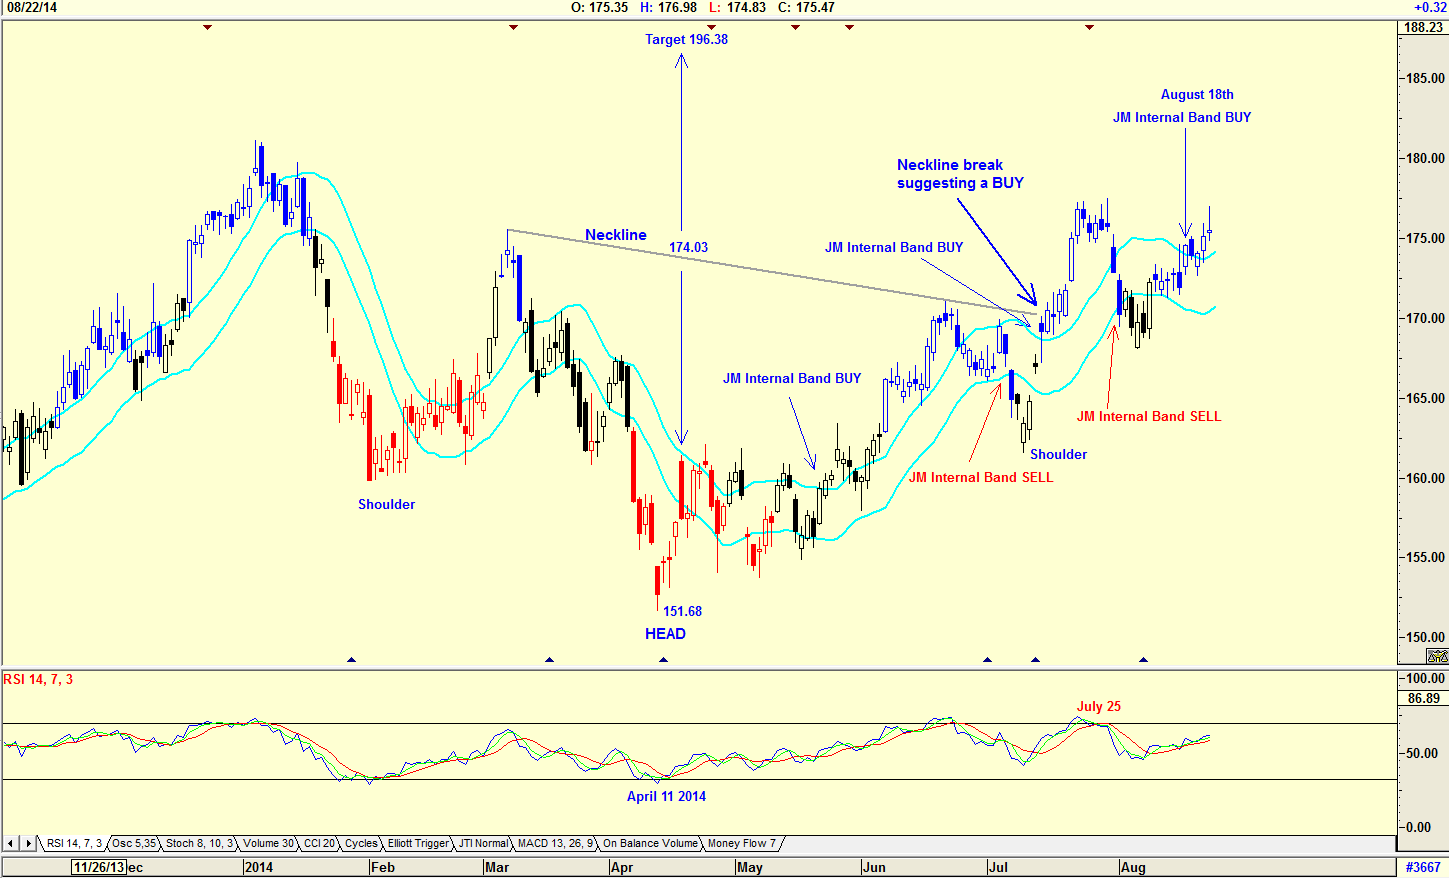
| Goldman Sachs (GS) has agreed to a settlement worth $1.2 billion to resolve a US regulator's claims that the bank sold Fannie Mae and Freddie Mac faulty mortgage bonds. However, the US Department Of Justice continues to investigate GS over its marketing of mortgage-backed securities. With an inverted head & shoulders developing in the chart, does this mean that GS is now a buy? |

|
| Figure 1. DAILY CHART. Here you see an inverted head & shoulder pattern plus JM Internal Band. |
| Graphic provided by: AdvancedGET. |
| |
| The chart in Figure 1 shows the inverted head & shoulders pattern that has developed, suggesting a price target of $196.38 (174.03-151.68=22.35+174.03=196.38). Fundamentally, you can argue that investors may have guessed that the bank would come to a settlement agreement with the US regulator, but this was a gamble that may not have paid off. The inverted head & shoulders pattern that formed and the buy signals given by the JM Internal Band would definitely have influenced them in their decision making. The JM internal band is a 15-period simple moving average offset by 2% positive and 2% negative. The indicator on the chart is a 14-period relative strength index (RSI) which is suggesting weakness since it gave a sell signal on July 25, 2014. |

|
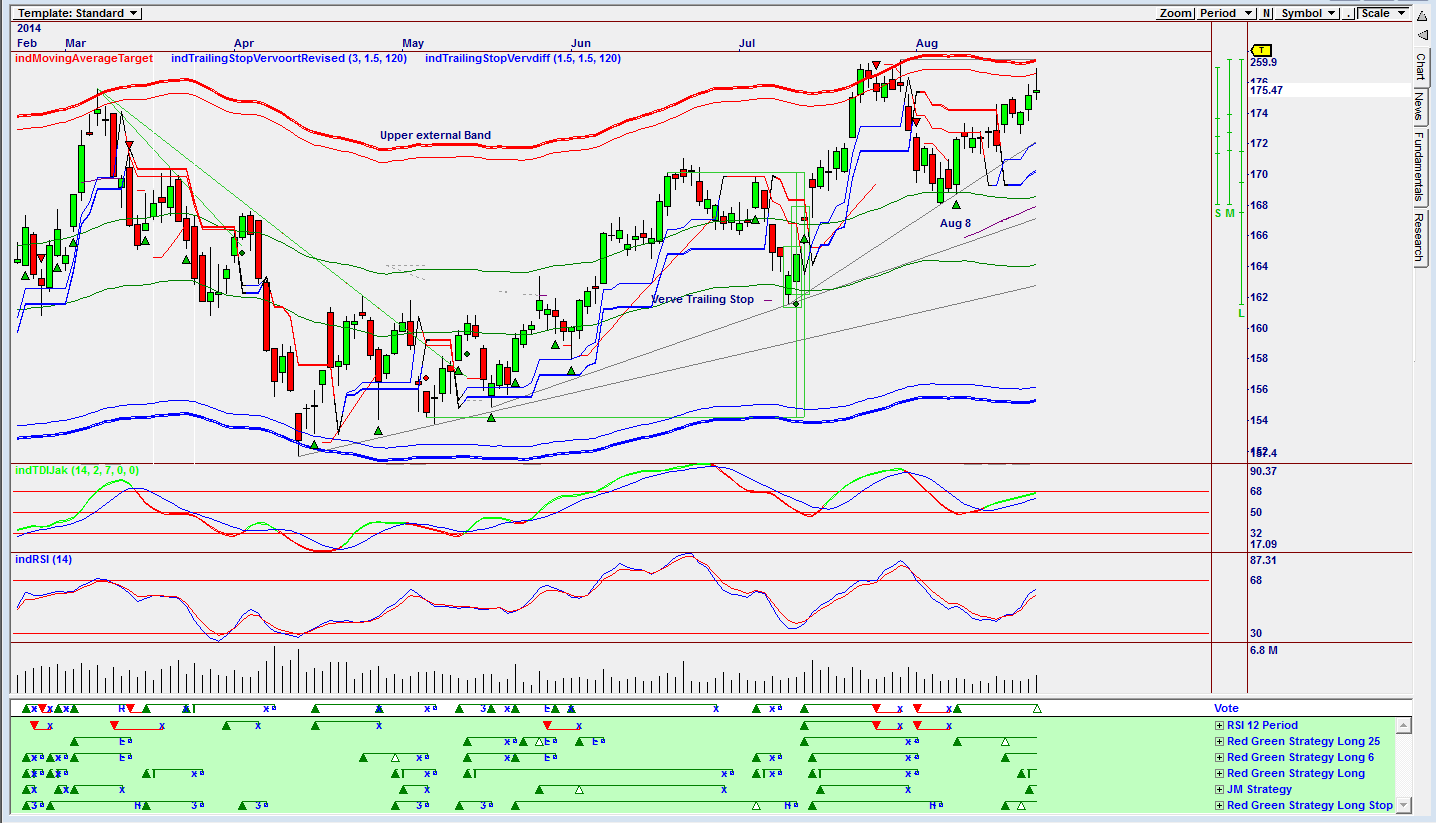
| Figure 2. BUY SIGNAL.On this Omnitrader chart, a buy signal has been given on August 8, 2014. |
| Graphic provided by: Omnitrader. |
| |
| The chart in Figure 2 is an Omnitrader chart suggesting a buy signal on August 8, 2014 as shown on the Vote line. The signal was given by the Red Green Strategy Long 25, and then confirmed by all the other strategies as the share price moved — with the exception of the 12-period RSI strategy. However, the share price is flirting with the upper external band suggesting that should you wish to buy the share, you are better off waiting for a pullback. Yes, I would be a buyer of GS for a long-term hold, but I would wait for a correction before buying. |
Has been a technical analyst since 1969, and has worked as a futures and options trader with First Financial Futures in Johannesburg, South Africa.
| Address: | 3256 West 24th Ave |
| Vancouver, BC | |
| Phone # for sales: | 6042634214 |
| E-mail address: | petroosp@gmail.com |
Click here for more information about our publications!
Comments

|

Request Information From Our Sponsors
- StockCharts.com, Inc.
- Candle Patterns
- Candlestick Charting Explained
- Intermarket Technical Analysis
- John Murphy on Chart Analysis
- John Murphy's Chart Pattern Recognition
- John Murphy's Market Message
- MurphyExplainsMarketAnalysis-Intermarket Analysis
- MurphyExplainsMarketAnalysis-Visual Analysis
- StockCharts.com
- Technical Analysis of the Financial Markets
- The Visual Investor
- VectorVest, Inc.
- Executive Premier Workshop
- One-Day Options Course
- OptionsPro
- Retirement Income Workshop
- Sure-Fire Trading Systems (VectorVest, Inc.)
- Trading as a Business Workshop
- VectorVest 7 EOD
- VectorVest 7 RealTime/IntraDay
- VectorVest AutoTester
- VectorVest Educational Services
- VectorVest OnLine
- VectorVest Options Analyzer
- VectorVest ProGraphics v6.0
- VectorVest ProTrader 7
- VectorVest RealTime Derby Tool
- VectorVest Simulator
- VectorVest Variator
- VectorVest Watchdog
