

HOT TOPICS LIST
- MACD
- Fibonacci
- RSI
- Gann
- ADXR
- Stochastics
- Volume
- Triangles
- Futures
- Cycles
- Volatility
- ZIGZAG
- MESA
- Retracement
- Aroon
INDICATORS LIST
LIST OF TOPICS
PRINT THIS ARTICLE
by Donald W. Pendergast, Jr.
Although Home Depot shares are a bit toppy near-term, the longer term picture looks exceedingly bright.
Position: N/A
Donald W. Pendergast, Jr.
Freelance financial markets writer and online publisher of the Trendzetterz.com S&P 500 Weekly Forecast service.
PRINT THIS ARTICLE
CYCLES
Home Depot: Near-Term Overbought, Long-Term Bullish
08/26/14 11:32:53 AMby Donald W. Pendergast, Jr.
Although Home Depot shares are a bit toppy near-term, the longer term picture looks exceedingly bright.
Position: N/A
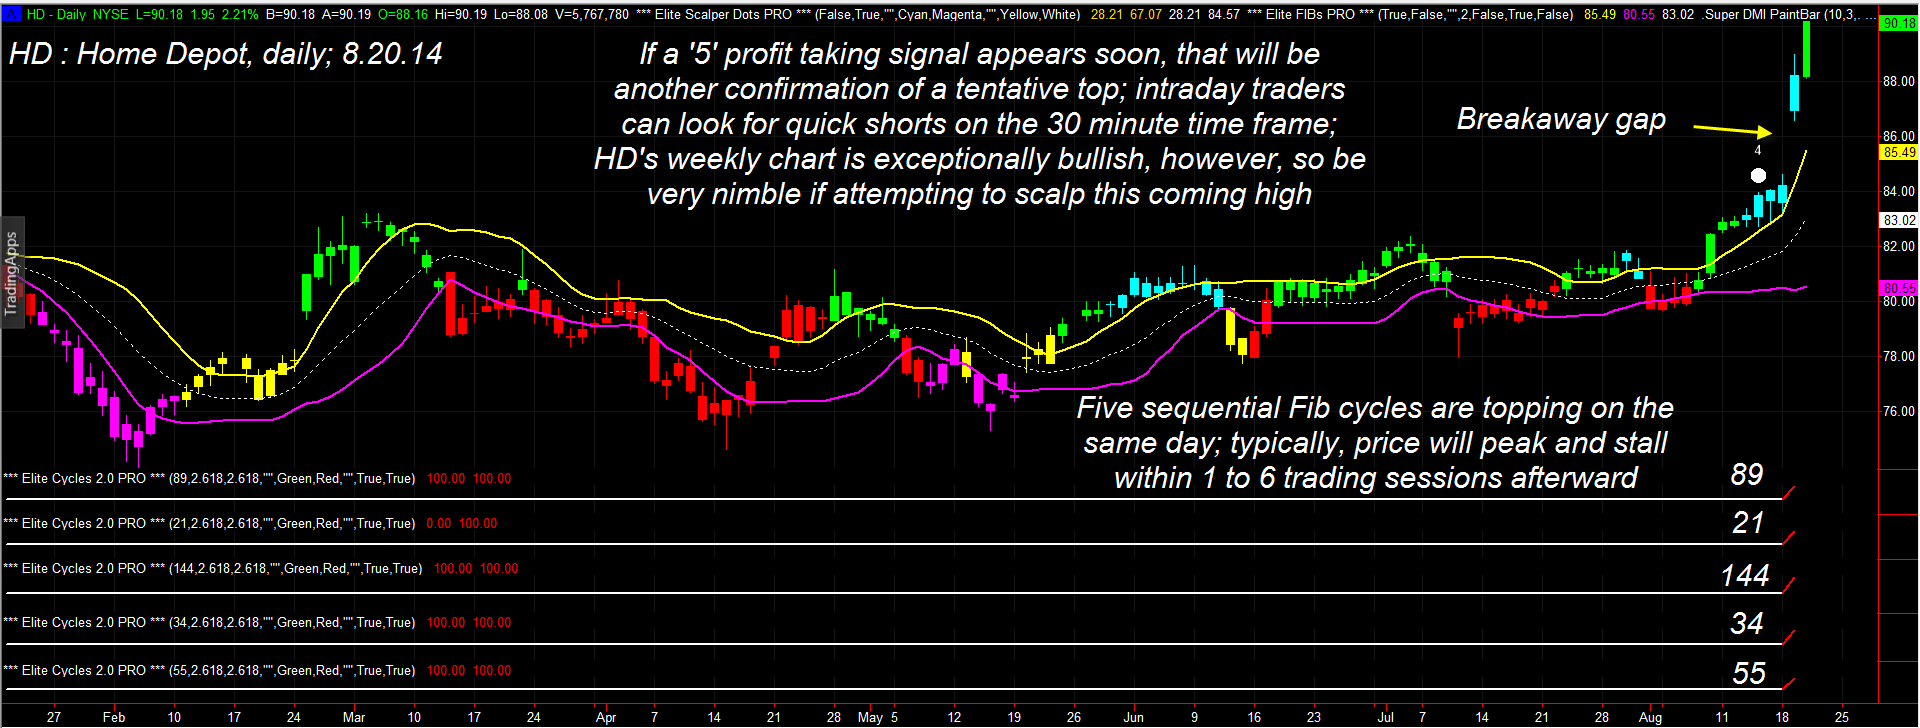
| Shares of Home Depot (HD) surged higher from a multimonth trading range recently; a powerful bullish breakaway gap soon followed, and with the stock having now hit several key actual/inferred resistance levels, wise traders will seek to short the stock on an intraday time frame even as swing traders wait for a pullback before jumping in for what could be another surge higher. Here's a closer look now (Figure 1). |
|
| Figure 1. Home Depot (HD) has gone parabolic after breaking higher from a multi-month trading range. When five key Fibonacci cycles top/bottom simultaneously, a reversal or stall is imminent. |
| Graphic provided by: TradeStation. |
| Graphic provided by: Elite Trader Indicators by Fibozachi.com. |
| |
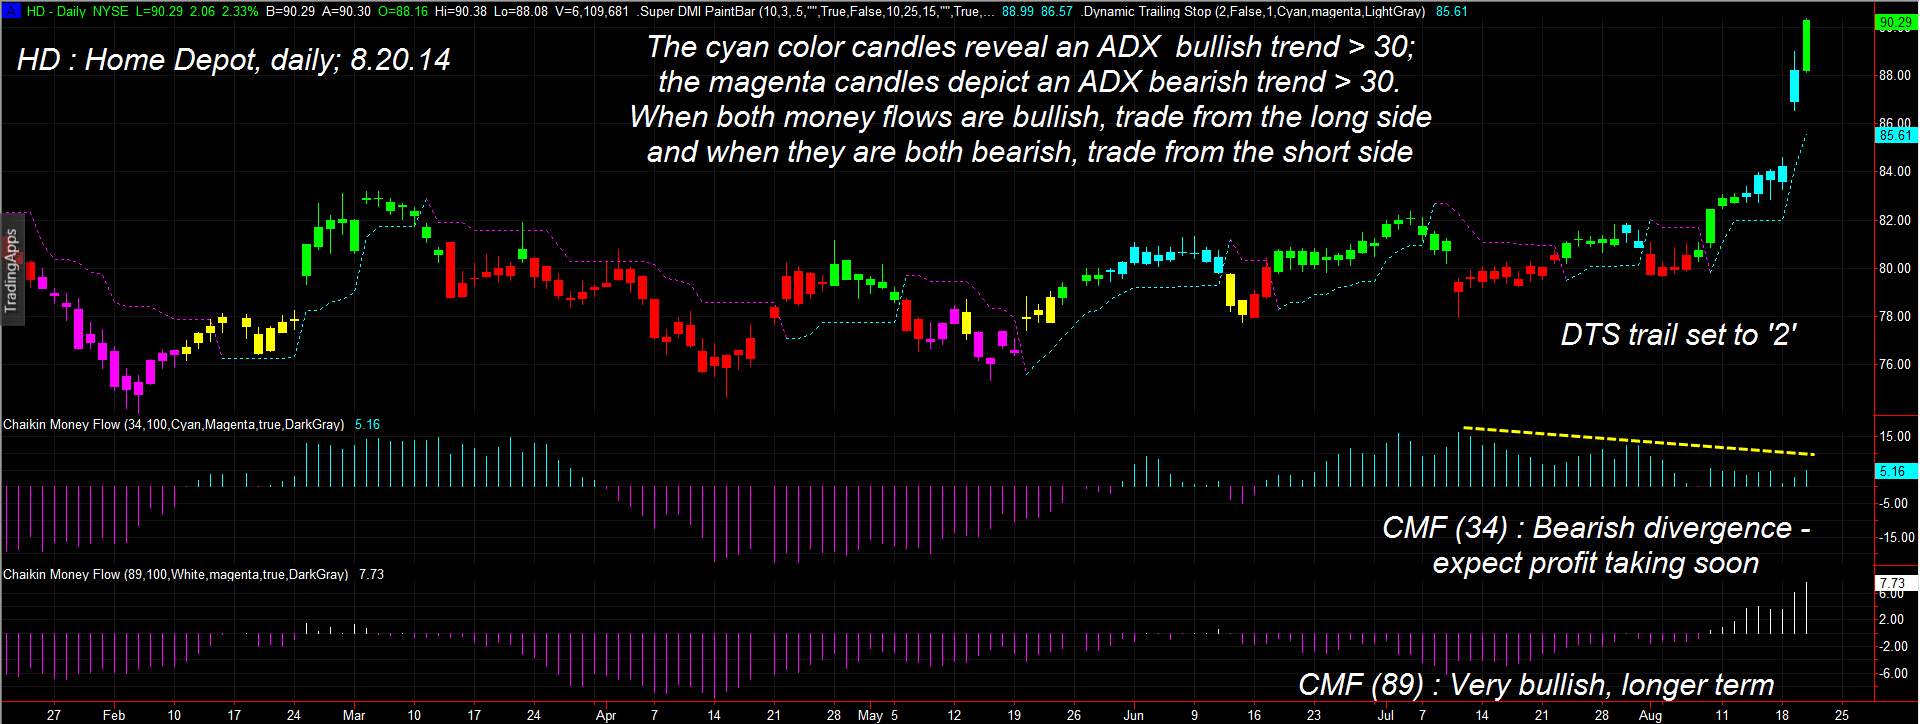
| Whenever a big-name stock stages an impressive breakout move (with or without the benefit of a large gap), it always pays to look at adjacent time frame charts (daily/weekly, weekly/monthly, 30-minute/120-minute, etc.) to discern the near-term support/resistance levels and the longer term trend. Here are the near-term obstacles standing in the way of further upward progress in HD over the next week or two: 1. Five sequential daily Fibonacci price cycles (21-, 34-, 55-, 89- and 144) have all topped on August 20, 2014. These are infrequent, yet reliable when all hit on the same day, warning of an imminent stall and/or reversal ahead. 2. The 34-day Chaikin Money Flow (CMF)(34) histogram is showing a substantial bearish divergence with price. 3. HD has just exceeded an extreme upper Keltner band (set at eight average true ranges away from a 40-day moving average) for the first time in more than twenty years. What all this means is simple enough — HD is extremely overbought for the near-term and that anyone who is happy with their swing gains in the stock since early August would do well to start selling out now, as a wave of profit taking should appear soon. It also means that speculative bears should start looking for prime short entry zones on their 15- to 30-minute charts, which could be good for a 1 to $2 pullback within the next few sessions. Listed below are the outrageously bullish technicals that suggest that longer term, HD is destined for at least the 105.00 to 110.00 area before the end of 2014. |
|
| Figure 2. HD's 34-day Chaikin Money Flow histogram reveals a pronounced bearish divergence with price; HD's weekly chart money flows are very bullish, however. |
| Graphic provided by: TradeStation. |
| Graphic provided by: Elite Trader Indicators by Fibozachi.com. |
| |
| 1. The break above the top 8ATR/40SMA Keltner band, although a short-term overbought signal, is actually a 'pound the table' bullish breakout signal of the highest order for weekly trend followers and covered call traders. 2. The 89-day CMF histogram is extremely bullish. 3. The 34- and 89-week CMF histograms are also bullish and rising. 4. Although there are still two trading days left this week (as of this writing on August 20, 2014), HD's current weekly range is already the largest seen for a bullish candle since March 17, 2000. 5. The breakout pattern on HD's weekly chart is even more bullish looking than that shown on the daily charts in Figure 1 and Figure 2. So, here's the game plan for HD going forward: A. If long from early August 2014, consider scaling out or even going to cash soon. B. If confident in HD's ability to break into the lower 100.00 area soon, wait for a modest pullback into the upper 80.00s before going long again; using a covered call with an 85.00 strike price and eight to 12 months of time value may prove to be a good investment, should HD begin a fresh surge after a minor round of profit taking. C. If you are a really sharp short-seller, look to go short on a 15-30-minute chart signal as the inevitable profit taking begins in the next few sessions; do not hold positions overnight, however, and set realistic profit targets. |
Freelance financial markets writer and online publisher of the Trendzetterz.com S&P 500 Weekly Forecast service.
| Title: | Market consultant and writer |
| Company: | Trendzetterz |
| Address: | 81 Hickory Hollow Drive |
| Crossville, TN 38555 | |
| Phone # for sales: | 904-303-4814 |
| Website: | trendzetterz.com |
| E-mail address: | support@trendzetterz.com |
Traders' Resource Links | |
| Trendzetterz has not added any product or service information to TRADERS' RESOURCE. | |
Click here for more information about our publications!
PRINT THIS ARTICLE

Request Information From Our Sponsors
- VectorVest, Inc.
- Executive Premier Workshop
- One-Day Options Course
- OptionsPro
- Retirement Income Workshop
- Sure-Fire Trading Systems (VectorVest, Inc.)
- Trading as a Business Workshop
- VectorVest 7 EOD
- VectorVest 7 RealTime/IntraDay
- VectorVest AutoTester
- VectorVest Educational Services
- VectorVest OnLine
- VectorVest Options Analyzer
- VectorVest ProGraphics v6.0
- VectorVest ProTrader 7
- VectorVest RealTime Derby Tool
- VectorVest Simulator
- VectorVest Variator
- VectorVest Watchdog
- StockCharts.com, Inc.
- Candle Patterns
- Candlestick Charting Explained
- Intermarket Technical Analysis
- John Murphy on Chart Analysis
- John Murphy's Chart Pattern Recognition
- John Murphy's Market Message
- MurphyExplainsMarketAnalysis-Intermarket Analysis
- MurphyExplainsMarketAnalysis-Visual Analysis
- StockCharts.com
- Technical Analysis of the Financial Markets
- The Visual Investor