

HOT TOPICS LIST
- MACD
- Fibonacci
- RSI
- Gann
- ADXR
- Stochastics
- Volume
- Triangles
- Futures
- Cycles
- Volatility
- ZIGZAG
- MESA
- Retracement
- Aroon
INDICATORS LIST
LIST OF TOPICS
PRINT THIS ARTICLE
by Billy Williams
The Priceline Group, Inc. has been range bound for 2014 but recent developments and a surprise announcement may launch it higher.
Position: Buy
Billy Williams
Billy Williams has been trading the markets for 27 years, specializing in momentum trading with stocks and options.
PRINT THIS ARTICLE
TECHNICAL ANALYSIS
Is PCLN Getting Squeezed?
08/26/14 11:23:53 AMby Billy Williams
The Priceline Group, Inc. has been range bound for 2014 but recent developments and a surprise announcement may launch it higher.
Position: Buy
| Online travel powerhouse, The Priceline Group, Inc. (PCLN), is making strides to regain its footing after pulling back from recent highs. PCLN has been a favorite of the bulls in recent years due to its leadership in the market. The stock price has risen more than 13-fold in the last five years but has stumbled for most of 2014. From a fast-moving stock on the move, PCLN has been range bound for all of 2014 and is facing significant challenges. Knowing the obstacles ahead can help you mitigate the risk but it's critical that you understand the journey that PCLN has traveled before considering a position. The stock was part of the dotcom era where in the late 90s it was a favorite among breakout traders who were drawn to its momentum. But, that was over in early 1999 when the stock cratered and many traders thought it would never recover. But, in the aftermath of the stock market meltdown, PCLN launched a comeback and found support with a double bottom that formed at the end of 2000 to almost two years later in 2002. From that low, the bulls began to re-enter the stock and PCLN took its first upward steps again into bullish territory. |
|
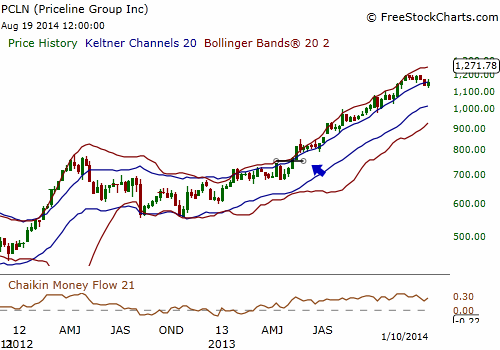
| Figure 1. PCLN's weekly chart showed a squeeze setup in May of last year which fired off a multi-month bull run. |
| Graphic provided by: www.freestockcharts.com. |
| |
| Despite the stock market turndown of 2002, the bear market of 2007, and the housing meltdown of 2008, PCLN kept climbing higher. In fact, after the stock bottomed in 2008, it soared higher after setting up in a squeeze pattern on the weekly price chart. The Bollinger Bands traded within the boundaries of the Keltner Channels revealing that the stock's volatility was falling. Since volatility reverts to its mean, it was a matter of time before the stock exploded in one direction or another. Since the stock's long-term and intermediate-term trend was established as bullish, an entry at the $775 level was warranted (Figure 1). Take note that a weekly squeeze setup is more powerful than a squeeze at the daily level and can last for months, even years, after it fires off. |
|
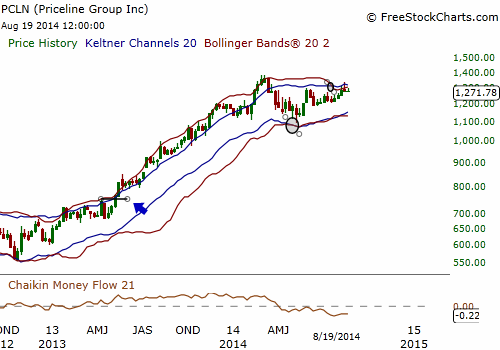
| Figure 2. After gaining almost 600 points, PCLN began to decline after peaking in March 2014. Now, a new weekly squeeze setup has formed and an entry signal may be on the horizon. |
| Graphic provided by: www.freestockcharts.com. |
| |
| In mid-May of 2013, PCLN broke higher and gained over 600 points in just 10 months. In early March 2014, price peaked and then declined to a May 2014 bottom. Currently, PCLN's price run has stalled and the stock has setup again in another squeeze setup on the weekly chart. The Fib retracements show that price has now traded up over the .618 retracement level and it's acting as minor support (Figure 2). |
|
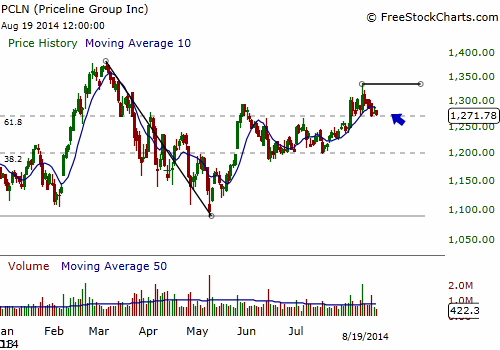
| Figure 3. The stock has retraced the length of its recent decline back to the .618 Fibonacci level and managed to trade above it. Now, it acts as minor support and a $1,330 entry is in play. |
| Graphic provided by: www.freestockcharts.com. |
| |
| Given this technical setup, an entry over the $1,330 level could be considered a valid entry point as the Bollinger Bands appear to be arcing out from the Keltner Channels again. This comes on the end of an announcement that PCLN is raising money to buy back its own stock. Buybacks historically reward the bulls as supply for the stock dries up and demand increases share value. If this scenario develops, then PCLN could have another multi-month bull run and a potential windfall gain. The overall market seems to be recovering from a long series of distribution days which would make PCLN one of the more attractive long candidates if everything comes together for the bulls. If price stalls, then you need to wait for it to assert itself again and then catch a ride to the upside as it breaks higher but still use a stop-loss point of 7% from your entry price and risk no more than 1-2% of your total capital. |
Billy Williams has been trading the markets for 27 years, specializing in momentum trading with stocks and options.
| Company: | StockOptionSystem.com |
| E-mail address: | stockoptionsystem.com@gmail.com |
Traders' Resource Links | |
| StockOptionSystem.com has not added any product or service information to TRADERS' RESOURCE. | |
Click here for more information about our publications!
PRINT THIS ARTICLE

Request Information From Our Sponsors
- StockCharts.com, Inc.
- Candle Patterns
- Candlestick Charting Explained
- Intermarket Technical Analysis
- John Murphy on Chart Analysis
- John Murphy's Chart Pattern Recognition
- John Murphy's Market Message
- MurphyExplainsMarketAnalysis-Intermarket Analysis
- MurphyExplainsMarketAnalysis-Visual Analysis
- StockCharts.com
- Technical Analysis of the Financial Markets
- The Visual Investor
- VectorVest, Inc.
- Executive Premier Workshop
- One-Day Options Course
- OptionsPro
- Retirement Income Workshop
- Sure-Fire Trading Systems (VectorVest, Inc.)
- Trading as a Business Workshop
- VectorVest 7 EOD
- VectorVest 7 RealTime/IntraDay
- VectorVest AutoTester
- VectorVest Educational Services
- VectorVest OnLine
- VectorVest Options Analyzer
- VectorVest ProGraphics v6.0
- VectorVest ProTrader 7
- VectorVest RealTime Derby Tool
- VectorVest Simulator
- VectorVest Variator
- VectorVest Watchdog