

HOT TOPICS LIST
- MACD
- Fibonacci
- RSI
- Gann
- ADXR
- Stochastics
- Volume
- Triangles
- Futures
- Cycles
- Volatility
- ZIGZAG
- MESA
- Retracement
- Aroon
INDICATORS LIST
LIST OF TOPICS
PRINT THIS ARTICLE
by Donald W. Pendergast, Jr.
When three significant price cycles bottom simultaneously, a tradable bullish reversal may soon appear.
Position: N/A
Donald W. Pendergast, Jr.
Freelance financial markets writer and online publisher of the Trendzetterz.com S&P 500 Weekly Forecast service.
PRINT THIS ARTICLE
CYCLES
BP: Near Major Multicycle Lows
08/22/14 01:29:56 PMby Donald W. Pendergast, Jr.
When three significant price cycles bottom simultaneously, a tradable bullish reversal may soon appear.
Position: N/A
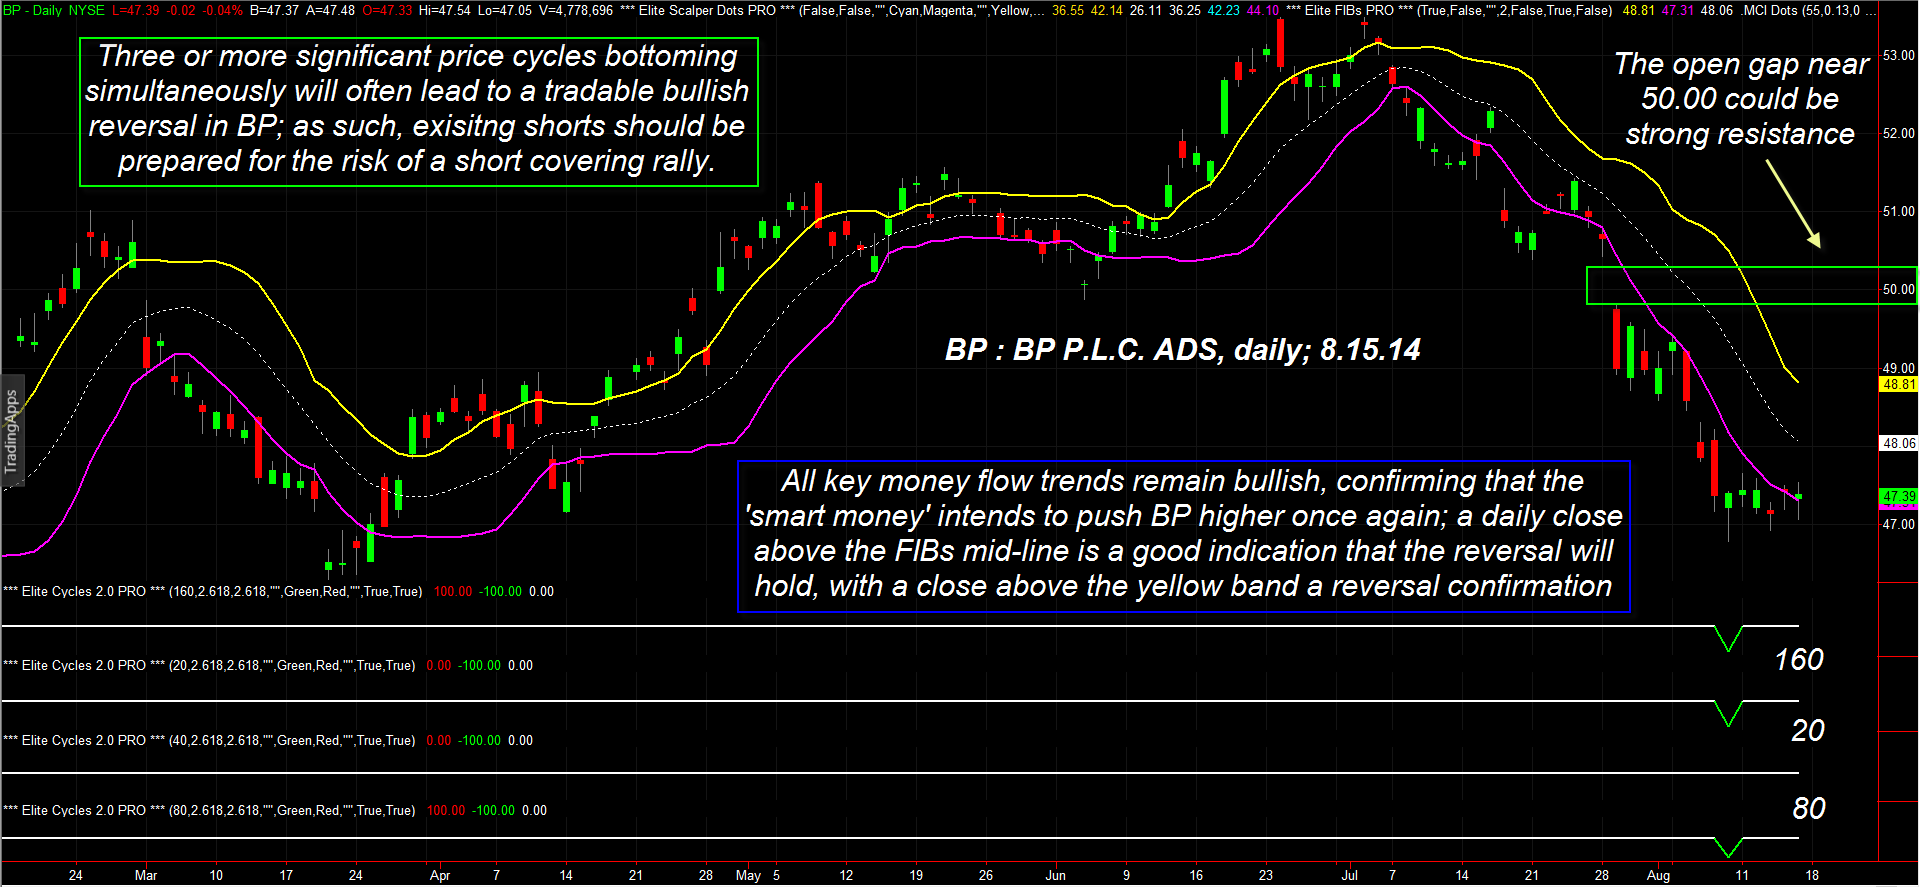
| Shares of BP P.L.C Adr (BP) have fallen steadily since peaking in early July 2014, but savvy chart readers and technicians already know that the stock may be setting up for a tradable bullish reversal in the near future. Here's a closer look now (Figure 1). |
|
| Figure 1.) BP P.L.C. Adr (BP): With three major cycles having bottomed in the past week at a time of still-bullish money flow trends and with the stock trading just above key support, savvy bulls will look for a new buy trigger soon even as shorts begin to cover. |
| Graphic provided by: TradeStation. |
| Graphic provided by: Elite Trader Indicators by Fibozachi.com. |
| |
| After BP peaked at 53.48 on July 2, 2014, a powerful bearish cycle pushed the stock lower by as much as 12.5%, making it the biggest sell-off for the shares since February 2013. Note how the stock stayed beneath the lower Elite FIBs PRO bands for most of the decline, confirming its bearish momentum; a trend in motion is a potent force and until BP can make a daily close back on top of the yellow band, the main trend must still be assumed to be down, however, there are several leading indicators that are strongly suggesting that most - if not all - of BP's sell-off is at or near a major reversal zone: 1. The stock's 20-, 80- and 160-day price cycles have just bottomed - simultaneously. 2. These cycle low confirming indicators have fired with BP trading a little above its next key support level at 46.29. 3. Five out of six key Chaikin Money flow histograms (CMF) are still in bullish posture; the 13-, 21-, 34-, 55-, 89- and 233-day money flows are all above their respective zero lines, with only the 144-day variant dipping into negative territory. Any skilled technician realizes that this is a recipe for an impending bullish trend reversal; that is, whenever a large cap stock sells off toward a key support level at the same time that the near-term and longer-term money flow trends are bullish and a major multicycle low is confirmed, well, that is the time to begin watching the stock for signs of a shift back toward higher prices - relatively soon. Obviously, the easiest way to determine if this is a valid cycle low reversal op is to look at the price performance of a stock coming out of similar bottoming phases in the past; in the case of BP, these green cycle low triangles do a good job of calling an impending bullish reversal, especially if three or more print very close to the same time window. Typically, BP will rise between 15-30% during the following six to 12 weeks after a multicycle low is confirmed as is the case right now. |
|
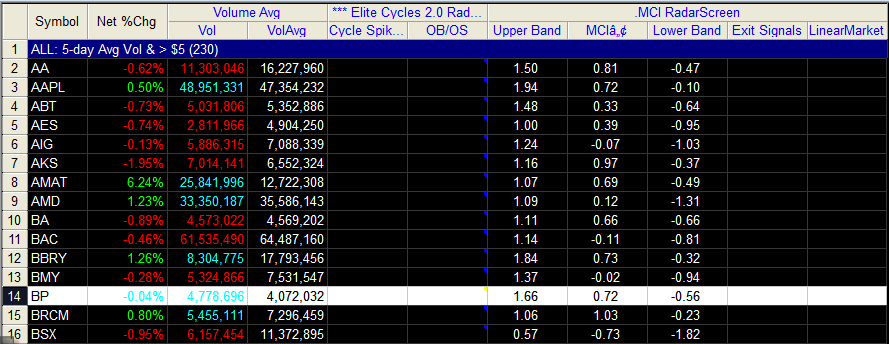
| Figure 2.) BP was nearly flat on the day for 8.15.14; daily trading volume was slightly below its 50-day average. |
| Graphic provided by: TradeStation. |
| Graphic provided by: TradeStation RadarScreen. |
| |
| It will take a little patience to wait for an 'official' entry point, which is when the stock can again make two consecutive closes above the yellow FIBs band, but that is really the safest time to enter a reversal trade like this. Once in, traders can use the midline or lower magenta band as their trailing stop, being sure to take at least partial profits if the open gap near 50.00 or a series of '5' profit taking signals appear before final stop out. BP makes nice, tradable swings most times, so this should be an easy stock to manage on this highly anticipated bullish reversal. Account risks should be kept at 2% or less and your portfolio should be well diversified with smooth swinging stocks making meaningful bullish/bearish reversals on the 120-minute or daily time frames. Trade wisely until we meet here again. |
Freelance financial markets writer and online publisher of the Trendzetterz.com S&P 500 Weekly Forecast service.
| Title: | Market consultant and writer |
| Company: | Trendzetterz |
| Address: | 81 Hickory Hollow Drive |
| Crossville, TN 38555 | |
| Phone # for sales: | 904-303-4814 |
| Website: | trendzetterz.com |
| E-mail address: | support@trendzetterz.com |
Traders' Resource Links | |
| Trendzetterz has not added any product or service information to TRADERS' RESOURCE. | |
Click here for more information about our publications!
Comments
Date:�08/25/14Rank:�5Comment:�

Request Information From Our Sponsors
- StockCharts.com, Inc.
- Candle Patterns
- Candlestick Charting Explained
- Intermarket Technical Analysis
- John Murphy on Chart Analysis
- John Murphy's Chart Pattern Recognition
- John Murphy's Market Message
- MurphyExplainsMarketAnalysis-Intermarket Analysis
- MurphyExplainsMarketAnalysis-Visual Analysis
- StockCharts.com
- Technical Analysis of the Financial Markets
- The Visual Investor
- VectorVest, Inc.
- Executive Premier Workshop
- One-Day Options Course
- OptionsPro
- Retirement Income Workshop
- Sure-Fire Trading Systems (VectorVest, Inc.)
- Trading as a Business Workshop
- VectorVest 7 EOD
- VectorVest 7 RealTime/IntraDay
- VectorVest AutoTester
- VectorVest Educational Services
- VectorVest OnLine
- VectorVest Options Analyzer
- VectorVest ProGraphics v6.0
- VectorVest ProTrader 7
- VectorVest RealTime Derby Tool
- VectorVest Simulator
- VectorVest Variator
- VectorVest Watchdog