

HOT TOPICS LIST
- MACD
- Fibonacci
- RSI
- Gann
- ADXR
- Stochastics
- Volume
- Triangles
- Futures
- Cycles
- Volatility
- ZIGZAG
- MESA
- Retracement
- Aroon
INDICATORS LIST
LIST OF TOPICS
PRINT THIS ARTICLE
by Donald W. Pendergast, Jr.
Shares of Hess Corporation appear to be at or very near a major high, with at least a 10-15% correction coming afterward.
Position: N/A
Donald W. Pendergast, Jr.
Freelance financial markets writer and online publisher of the Trendzetterz.com S&P 500 Weekly Forecast service.
PRINT THIS ARTICLE
REVERSAL
HES: Setting Up For Breakdown
08/22/14 11:40:32 AMby Donald W. Pendergast, Jr.
Shares of Hess Corporation appear to be at or very near a major high, with at least a 10-15% correction coming afterward.
Position: N/A
| From its June 29, 2012 multicycle low to its August 1, 2014 peak, shares of Hess Corporation (HES) rose by as much as 163%, which is an average monthly gain of approximately 6.49%. For all anyone knows, HES may go still higher in the longer term, but for the here and now, more than six technicals are suggesting that the line of least resistance is toward a 10-15% correction, sooner rather than later. Here's a closer look (Figure 1). |
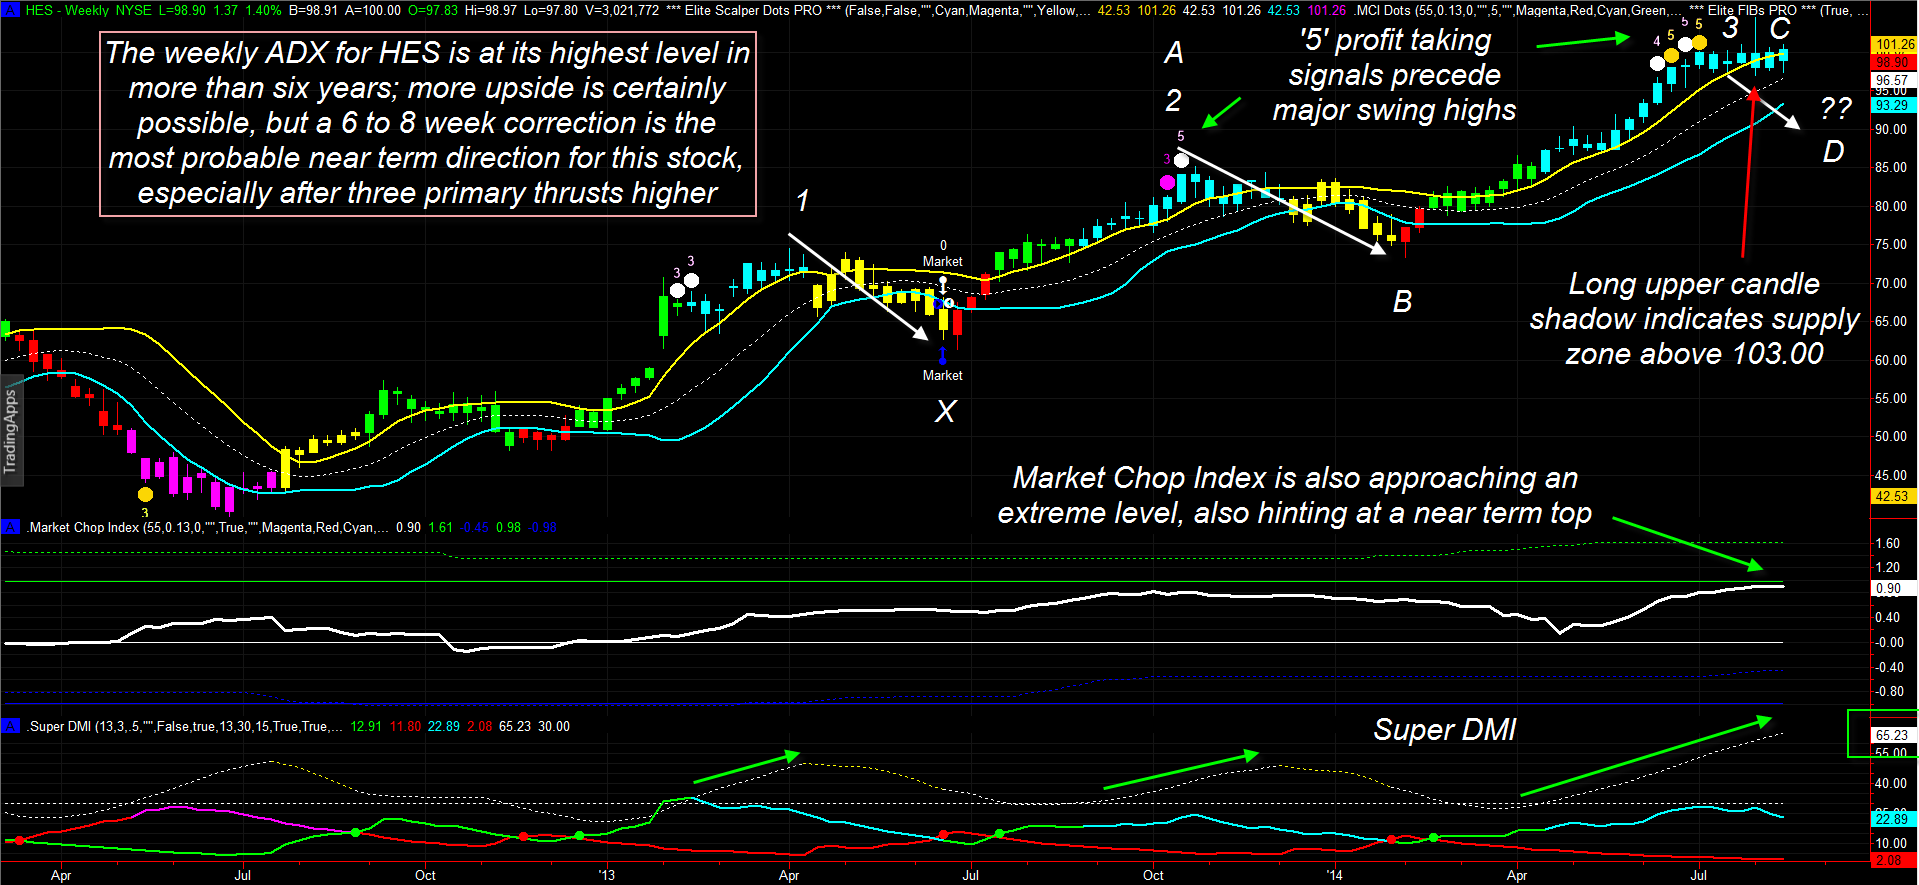
|
| Figure 1. Hess Corporation (HES) could be on the verge of at least a 10-15% correction — if not greater — after experiencing three powerful drives to a major top. |
| Graphic provided by: TradeStation. |
| Graphic provided by: Elite Trader Indicators by Fibozachi.com. |
| |
| The massive 25-month rally in HES has — so far — unfolded in three successive waves. In the first two waves, the ADX (average directional index) peaked out at levels of 49.88 and 48.99, respectively. After each peak (1 and 2), the stock experienced corrections of 17.67% and then 13.85%; with the weekly ADX now at a nosebleed level of 65.23, the next correction could be even deeper and faster that those witnessed since spring 2013. Here are the main weekly technicals: 1.The August 1, 2014 weekly candle has a long upper shadow, indicating abundant supply of stock for sale above 103.00. 2. The series of "4" and "5" profit-taking signals in June/July 2014 gave accurate advance warning of an imminent top. 3. The MCI (market chop index) is approaching a classic overbought level. 4. Savvy pro traders/technicians such as Linda Bradford Raschke and Larry Pesavento have referred to the "three drives to a top" phenomenon in all liquid markets; typically, after three strong, consecutive trend thrusts higher (lower), a market will stage a significant reversal. HES certainly appears to be ripe for such a reversal after its own weekly three-drive pattern. The daily chart (Figure 2) for HES reveals additional insights: A. The same cluster of "4" and "5" profit-taking signals appears just before price made a major high. B. ADX reached all the way to 77.88 as the last of the profit-taking signals appeared. C. The MCI put in a sell signal (red dot) two sessions after the ADX peaked and rolled over. D. HES then began to go sideways, but note the cyan fakeout bullish breakout bar of July 30, 2014; this is a classic bull trap/wash-and-rinse job by the smart money (they're your friends, always remember that...yeah, right!) and was a clear signal that they intended to take HES lower in the days to come. E. The DMI is now showing a bearish shift for the first time in eight months. Taken as a whole, if you're still long HES and have not yet begun to scale out, sell and go to cash or buy protective puts. |

|
| Figure 2. The daily chart of HES reveals an image of a stock that is under heavy institutional distribution after making a major high. Key Fibonacci price targets for a selloff abound in the lower 90.00 to upper 80.00 price ranges. |
| Graphic provided by: TradeStation. |
| Graphic provided by: Elite Trader Indicators by Fibozachi.com. |
| |
| Look for breaks below 96.97 and then 95.44 to unleash strong bearish forces in HES; the 95.44 level is the bottom of the larger consolidation pattern and when that goes, look for the stock to make a fast run to the low 90s or upper 80s. Here are the key Fibonacci swing price targets, based on the ABC swings on the weekly chart in Figure 1: * 100% AB = 92.71 * 127% AB 89.53 * 162% AB = 85.42 The 100% and 127% targets should be seen fairly quickly after a successful break below the consolidation pattern. Buying in-the-money (ITM) put options with four to six months of time value should help traders stay with a progressive correction in HES, while having less risk than an outright short sale of stock. Normally, reversal trades should only have a 1% account risk per trade, but since this is such a high-probability setup, an upper limit of 2% is also acceptable as long as you manage the trade properly and scale out as the above price targets are reached. Trade wisely until we meet here again. |
Freelance financial markets writer and online publisher of the Trendzetterz.com S&P 500 Weekly Forecast service.
| Title: | Market consultant and writer |
| Company: | Trendzetterz |
| Address: | 81 Hickory Hollow Drive |
| Crossville, TN 38555 | |
| Phone # for sales: | 904-303-4814 |
| Website: | trendzetterz.com |
| E-mail address: | support@trendzetterz.com |
Traders' Resource Links | |
| Trendzetterz has not added any product or service information to TRADERS' RESOURCE. | |
Click here for more information about our publications!
Comments

Request Information From Our Sponsors
- StockCharts.com, Inc.
- Candle Patterns
- Candlestick Charting Explained
- Intermarket Technical Analysis
- John Murphy on Chart Analysis
- John Murphy's Chart Pattern Recognition
- John Murphy's Market Message
- MurphyExplainsMarketAnalysis-Intermarket Analysis
- MurphyExplainsMarketAnalysis-Visual Analysis
- StockCharts.com
- Technical Analysis of the Financial Markets
- The Visual Investor
- VectorVest, Inc.
- Executive Premier Workshop
- One-Day Options Course
- OptionsPro
- Retirement Income Workshop
- Sure-Fire Trading Systems (VectorVest, Inc.)
- Trading as a Business Workshop
- VectorVest 7 EOD
- VectorVest 7 RealTime/IntraDay
- VectorVest AutoTester
- VectorVest Educational Services
- VectorVest OnLine
- VectorVest Options Analyzer
- VectorVest ProGraphics v6.0
- VectorVest ProTrader 7
- VectorVest RealTime Derby Tool
- VectorVest Simulator
- VectorVest Variator
- VectorVest Watchdog