

HOT TOPICS LIST
- MACD
- Fibonacci
- RSI
- Gann
- ADXR
- Stochastics
- Volume
- Triangles
- Futures
- Cycles
- Volatility
- ZIGZAG
- MESA
- Retracement
- Aroon
INDICATORS LIST
LIST OF TOPICS
PRINT THIS ARTICLE
by Donald W. Pendergast, Jr.
Nine different technical indicators are warning of a high-probability trend reversal in shares of Alcoa Inc.
Position: N/A
Donald W. Pendergast, Jr.
Freelance financial markets writer and online publisher of the Trendzetterz.com S&P 500 Weekly Forecast service.
PRINT THIS ARTICLE
REVERSAL
Alcoa: Bearish Trend Reversal Due
08/15/14 02:01:03 PMby Donald W. Pendergast, Jr.
Nine different technical indicators are warning of a high-probability trend reversal in shares of Alcoa Inc.
Position: N/A
| With multiple technical indicators now flashing trend reversal signals for Alcoa Inc. (AA), existing longs should already be preparing for an exit, whether scaling out or moving their trailing stops closer on their long-term positions, even as swing traders get prepared for a high-probability downswing in the nearer term. Here's a closer look at AA's in-progress reversal on two time frames. |
|
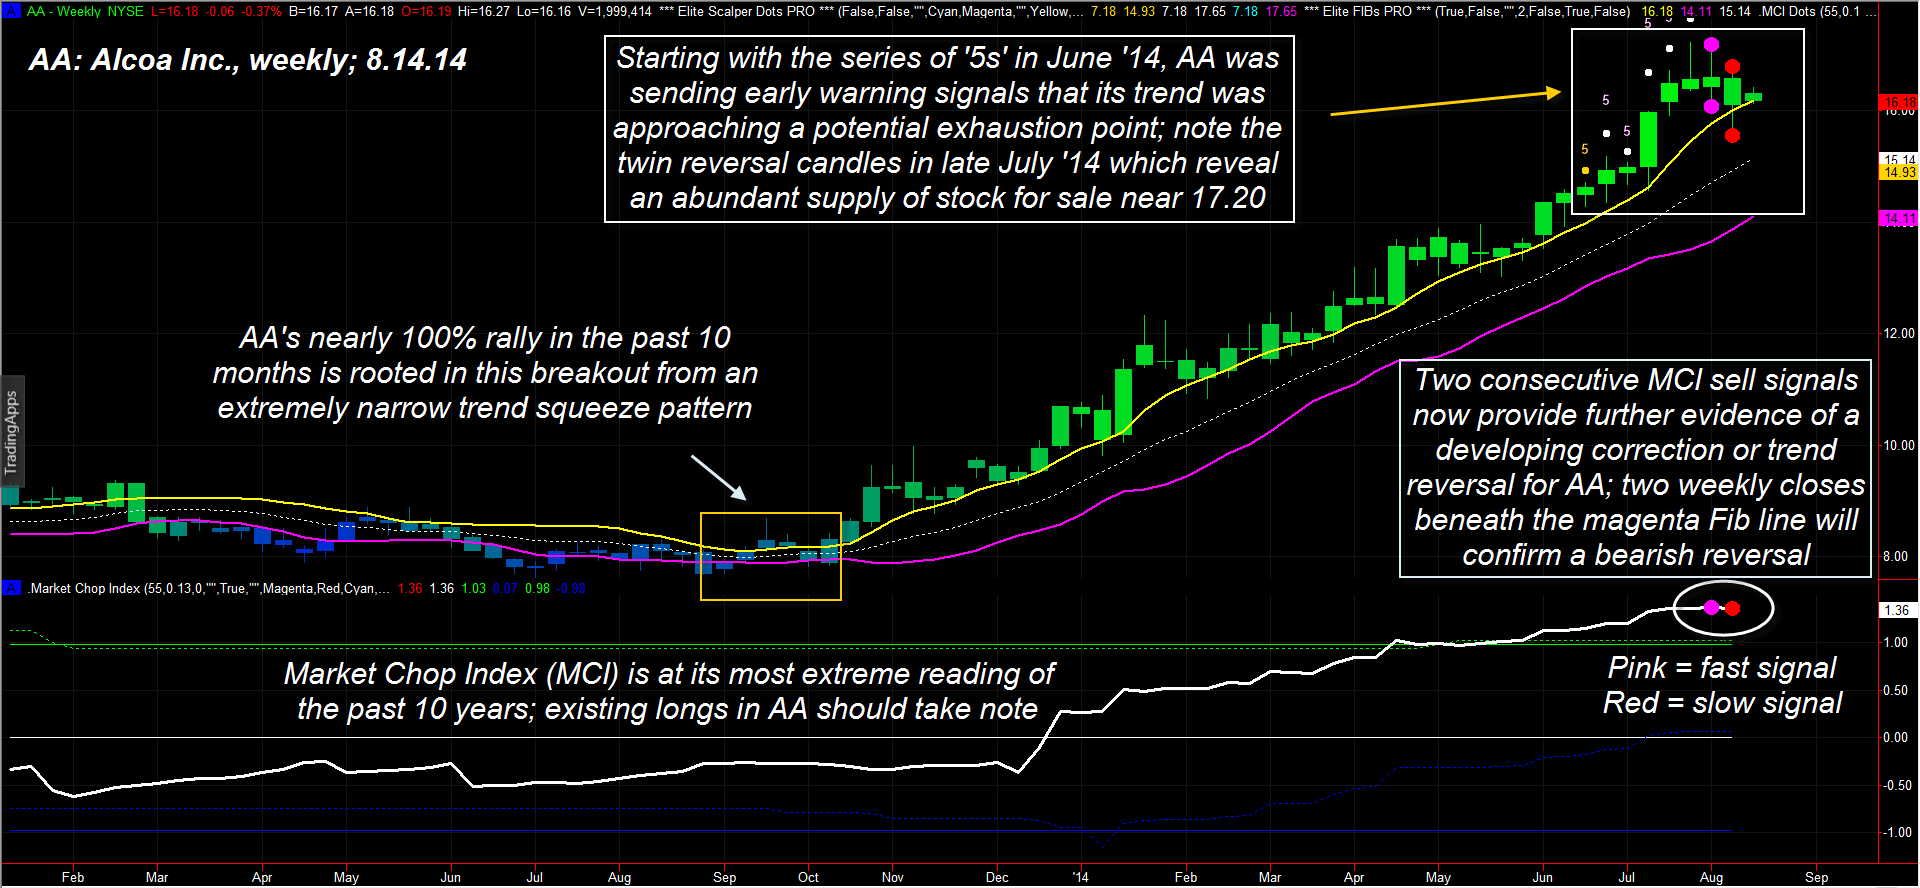
| Figure 1: Alcoa Inc. (AA) is extremely vulnerable to a bearish trend reversal on its weekly time frame after a nearly 100% rally in only 10 months. |
| Graphic provided by: TradeStation. |
| Graphic provided by: Elite Trader Indicators by Fibozachi.com. |
| |
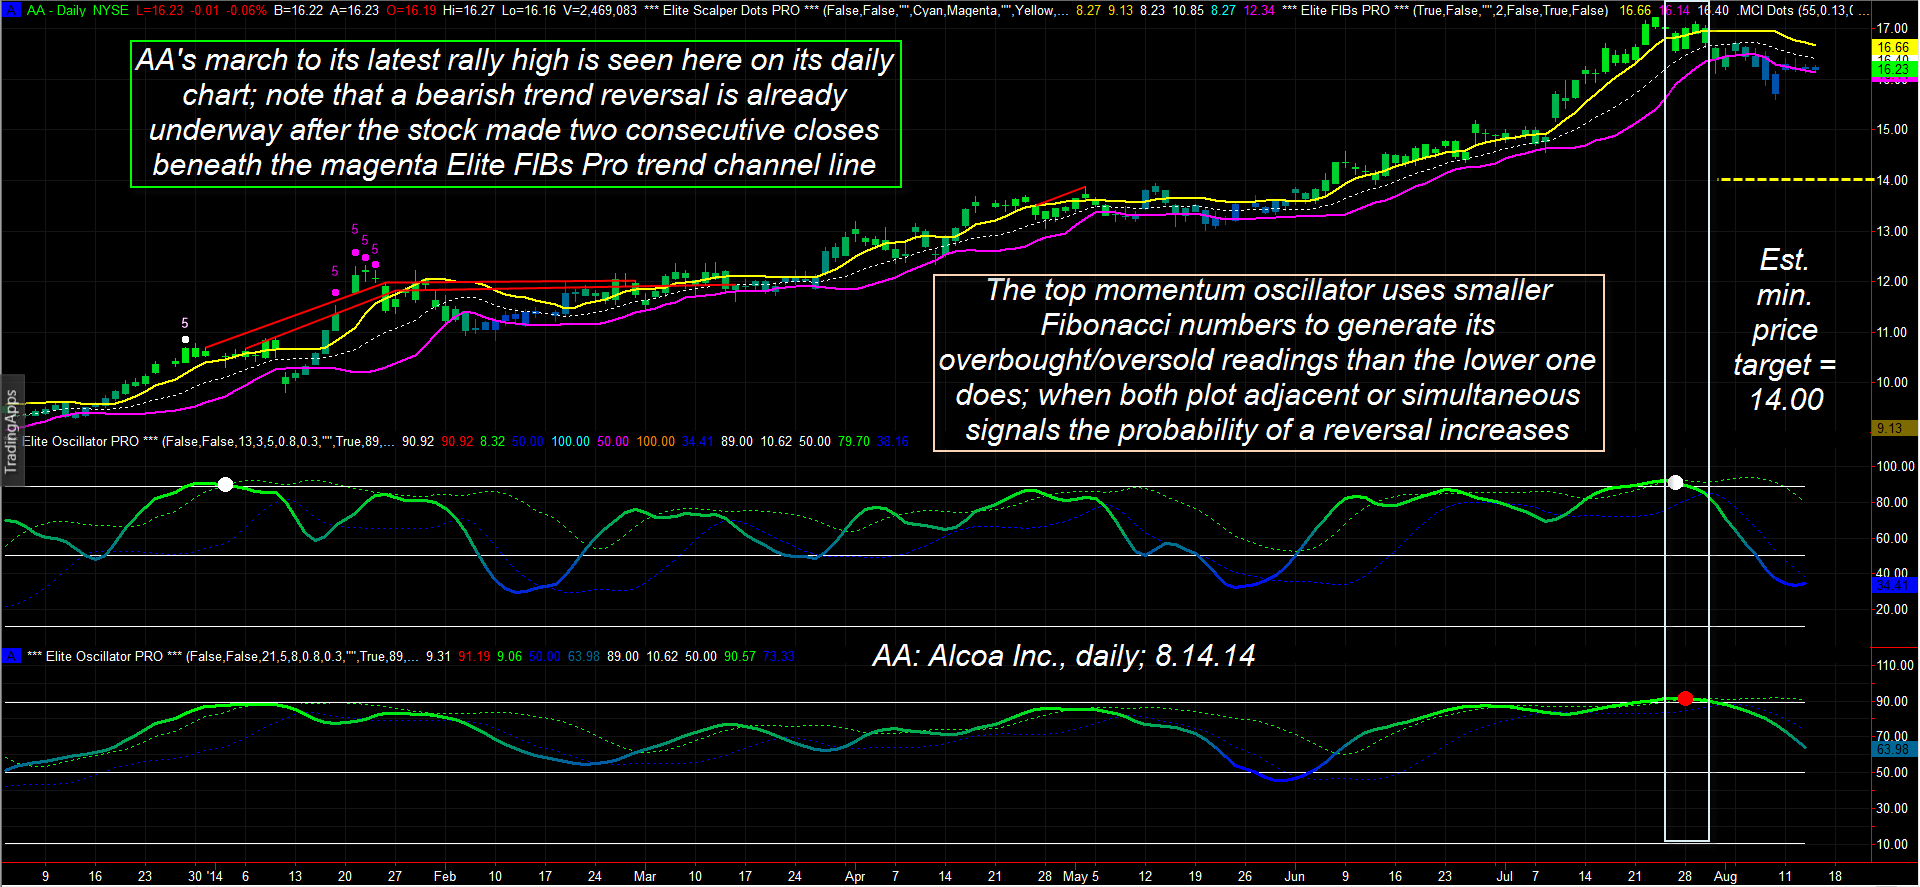
| Alcoa Inc.'s powerful multimonth rally may be at or near the stalling point, according to a bevy of technical indicators on both its daily and weekly charts. Such indications don't arrive very often, but when they do begin to appear after a stock is up by 50, 60, 75 or even 100% in less than a year, a significant -- and tradable -- reversal is likely not far off. Such advance warnings also give a timely heads-up alert to existing longs, helping them to prepare for an upcoming exit. AA's mammoth trend was birthed out of the incredibly narrow weekly trend squeeze that occurred when the Fib bands (Elite FIBs Pro) constricted severely during September-October 2013 just prior to the first stage of a 10-month-long bullish trend. Once AA surged above the top (yellow) band, the stock never looked back, staying right with the upper band in a rock-solid trend lasting until early this month (August 2014). Note how stable and steady the spread between the upper and lower bands remained, week after week. But once AA made it up to the 14.70 area (in late June 2014), a #5 scalp signal appeared, followed by five in a row, the last one appearing on 7/25/2014. As this all played out, numerous other and more powerful weekly trend-exhaustion signals manifested: 1. The top two weekly candles have long upper shadows, confirming an abundant supply of AA shares available near 17.20 2. The fast momentum oscillator issued a sell signal 3. The Cycle PRO 2 indicator issued a very infrequent sell signal (not shown) 4. The market chop index (MCI) issued two consecutive sell signals, the first seen in more than 10 years. On AA's daily chart, other dynamics confirm the reversal is well underway: A. The Cycle PRO 2 indicator flashed a sell on 7/23/2014 B. The fast and slow momentum oscillators issued sequential sells on 7/25/2014 and 7/28/2014 C. After peaking at 17.22, AA began to break lower, crossing below all three Fib bands, making a tentative low at 15.60 on 8/8/2014. Obviously, this particular agglomeration of trend-exhaustion indicators did a very good job of anticipating -- and confirming -- a bearish trend reversal in AA. As long as AA continues to make daily closes below the daily chart's upper Fib band, the trend must still be considered to be down; once the weekly chart makes a close below 15.60, this daily downtrend should begin to accelerate. Longer-term traders should continue to watch for a possible close below the weekly chart's lower (magenta) Fib band, which confirms a weekly bearish reversal. |
|
| Figure 2: AA has already begun the initial stages of a bearish trend reversal on its daily time frame. |
| Graphic provided by: TradeStation. |
| Graphic provided by: Elite Trader Indicators by Fibozachi.com. |
| |
| How to use this information? Well, anyone currently long AA on a weekly trading time frame needs to be using the magenta Fib band as a trailing stop level, and/or scaling out as a preemptive measure. Daily-based traders should already be short and may consider adding on more shorts once 15.60 is taken out unless stopped out first. For daily chart traders, the anticipated profit target is near 14.00, as that's where there is a powerful support level. Account risks should be kept at 2% or less, depending on where your actual short entry points are. Trade wisely until we meet here again. |
|
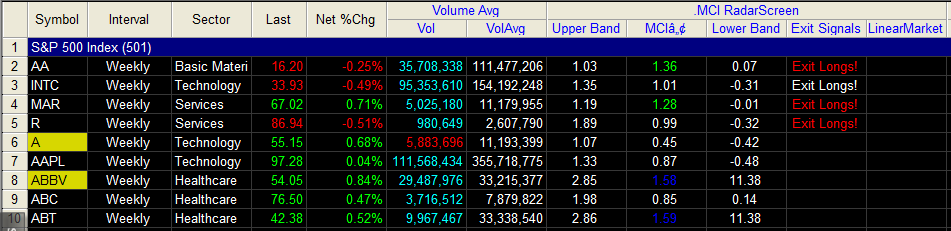
| Figure 3: Among the four S&P 500 index (.SPX) stocks issuing weekly "exit long" signals, AA has the strongest rating. |
| Graphic provided by: TradeStation. |
| Graphic provided by: TradeStation RadarScreen/Fibozachi.com indicators. |
| |
Freelance financial markets writer and online publisher of the Trendzetterz.com S&P 500 Weekly Forecast service.
| Title: | Market consultant and writer |
| Company: | Trendzetterz |
| Address: | 81 Hickory Hollow Drive |
| Crossville, TN 38555 | |
| Phone # for sales: | 904-303-4814 |
| Website: | trendzetterz.com |
| E-mail address: | support@trendzetterz.com |
Traders' Resource Links | |
| Trendzetterz has not added any product or service information to TRADERS' RESOURCE. | |
Click here for more information about our publications!
PRINT THIS ARTICLE

Request Information From Our Sponsors
- StockCharts.com, Inc.
- Candle Patterns
- Candlestick Charting Explained
- Intermarket Technical Analysis
- John Murphy on Chart Analysis
- John Murphy's Chart Pattern Recognition
- John Murphy's Market Message
- MurphyExplainsMarketAnalysis-Intermarket Analysis
- MurphyExplainsMarketAnalysis-Visual Analysis
- StockCharts.com
- Technical Analysis of the Financial Markets
- The Visual Investor
- VectorVest, Inc.
- Executive Premier Workshop
- One-Day Options Course
- OptionsPro
- Retirement Income Workshop
- Sure-Fire Trading Systems (VectorVest, Inc.)
- Trading as a Business Workshop
- VectorVest 7 EOD
- VectorVest 7 RealTime/IntraDay
- VectorVest AutoTester
- VectorVest Educational Services
- VectorVest OnLine
- VectorVest Options Analyzer
- VectorVest ProGraphics v6.0
- VectorVest ProTrader 7
- VectorVest RealTime Derby Tool
- VectorVest Simulator
- VectorVest Variator
- VectorVest Watchdog