HOT TOPICS LIST
- MACD
- Fibonacci
- RSI
- Gann
- ADXR
- Stochastics
- Volume
- Triangles
- Futures
- Cycles
- Volatility
- ZIGZAG
- MESA
- Retracement
- Aroon
INDICATORS LIST
LIST OF TOPICS
PRINT THIS ARTICLE
by Billy Williams
Concho Resources, Inc. is setting up shop in a major oil shale reservoir. Is it time to buy its stock?
Position: Hold
Billy Williams
Billy Williams has been trading the markets for 27 years, specializing in momentum trading with stocks and options.
PRINT THIS ARTICLE
STOCKS
Concho: The New King Of The Oil Patch
08/19/14 04:14:47 PMby Billy Williams
Concho Resources, Inc. is setting up shop in a major oil shale reservoir. Is it time to buy its stock?
Position: Hold
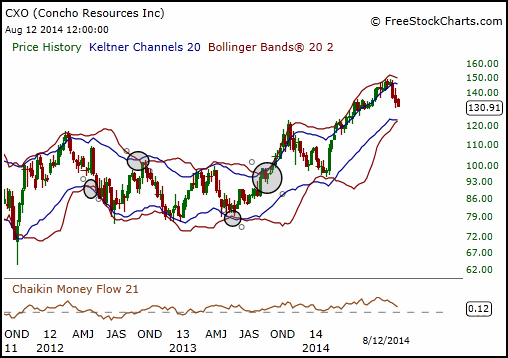
| Energy is surging and big multinational oil conglomerates are ramping up exploration around the globe at a record pace. But here in the U.S., oil shale production is taking center stage as new technology makes it possible to tap into energy. Massive oil shale deposits have been found throughout the U.S., but one major reserve in the U.S. has oil companies scrambling to stake their claim. Billions of dollars are pouring into the Texas Permian Basin and Eagle Ford sprawl in the state of Texas, lifting the state's output back above three million barrels per day (bpd) for the first time in more than three decades. With 44 billion in capital pouring into both areas, Concho Resources Inc. (CXO) is scrambling to be the leader in oil shale production. CXO debuted in 2007 with an IPO and quickly rose in price but then got smacked down with the rest of the market during the housing crisis in 2008. Undeterred, the stock's price action showed grit and tenacity as it clawed back from a steep decline and went through several squeeze pattern setups on the weekly price chart (Figure 1). You can often spot a squeeze when you overlay Bollinger Bands and Keltner channels on the stock's price chart. |

|
| CXO's weekly price chart reveals several "squeeze" setups taking place, but not until early this year has price followed through to break above $123. The result could be the beginning of a bull run that could last months or even years. |
| Graphic provided by: www.freestockcharts.com. |
| |
| When the Bollinger Bands contract within the Keltner channels, a squeeze is in effect. This is a powerful setup because Bollinger Bands reveal that volatility is either contracting or expanding; volatility reverts back to its mean so low volatility leads to high volatility and vice versa. In a squeeze pattern, volatility is falling, which is why the bands contract within the Keltner channels, which are based on the low, close, and open of daily price action. This trading within the Keltner channels tells you that volatility is low but will eventually revert to its mean. Like a stretched rubber band, price will explode in a given direction back to high volatility. On a weekly price chart, when price rises from a contracted price range, the explosive price expansion can go on for months, even years. |
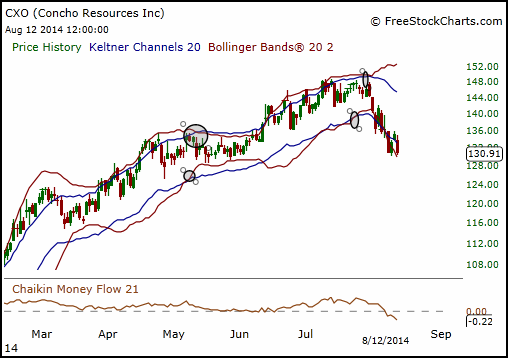
| In May 2009, the Bollinger Bands were outside the Keltner channels, signaling that price expansion was forming. The stock moved into a bullish trend that lasted till March 2011, gaining almost 80 points -- a 200%-plus gain in less than two years. For the next three years, CXO entered a period of price contraction and was stuck in a trading range. The stock had signaled several squeeze patterns but did not follow through. Like the previous weekly squeeze, the next signal could usher in a lasting price move, but not until the bulls take control of the stock's price. On the daily chart in Figure 2, price has flirted with the bulls but failed to follow through and surge higher despite breaking above resistance at $123. |

|
| Price has not been able to muster the strength to surge higher. Squeeze setups have occurred, but the stock price declined too sharply to be considered a good buy candidate. However, the long-term trend favors the bulls and CXO should be on your watchlist. |
| Graphic provided by: www.freestockcharts.com. |
| |
| What's troubling is that the stock's recent price action has been so weak that it violated institutional support at the 50-day simple moving average (SMA). These recent developments suggest that the stock is acting weak on fears of a market correction. The stock's long-term trend is in place, but until it is clear that the market is resuming its upward trend and CXO musters some strength on the next rally, the stock should simply be on your watchlist. It's not time to take new entries. If those two conditions change, then the trend favors the bulls and you should look to go long at a $149 breakout or buy during a pullback. |
Billy Williams has been trading the markets for 27 years, specializing in momentum trading with stocks and options.
| Company: | StockOptionSystem.com |
| E-mail address: | stockoptionsystem.com@gmail.com |
Traders' Resource Links | |
| StockOptionSystem.com has not added any product or service information to TRADERS' RESOURCE. | |
Click here for more information about our publications!
Comments

Request Information From Our Sponsors
- StockCharts.com, Inc.
- Candle Patterns
- Candlestick Charting Explained
- Intermarket Technical Analysis
- John Murphy on Chart Analysis
- John Murphy's Chart Pattern Recognition
- John Murphy's Market Message
- MurphyExplainsMarketAnalysis-Intermarket Analysis
- MurphyExplainsMarketAnalysis-Visual Analysis
- StockCharts.com
- Technical Analysis of the Financial Markets
- The Visual Investor
- VectorVest, Inc.
- Executive Premier Workshop
- One-Day Options Course
- OptionsPro
- Retirement Income Workshop
- Sure-Fire Trading Systems (VectorVest, Inc.)
- Trading as a Business Workshop
- VectorVest 7 EOD
- VectorVest 7 RealTime/IntraDay
- VectorVest AutoTester
- VectorVest Educational Services
- VectorVest OnLine
- VectorVest Options Analyzer
- VectorVest ProGraphics v6.0
- VectorVest ProTrader 7
- VectorVest RealTime Derby Tool
- VectorVest Simulator
- VectorVest Variator
- VectorVest Watchdog
