

HOT TOPICS LIST
- MACD
- Fibonacci
- RSI
- Gann
- ADXR
- Stochastics
- Volume
- Triangles
- Futures
- Cycles
- Volatility
- ZIGZAG
- MESA
- Retracement
- Aroon
INDICATORS LIST
LIST OF TOPICS
PRINT THIS ARTICLE
by Chaitali Mohile
The healthy rally of Halliburton Company stock offers good short-term trading opportunities.
Position: Sell
Chaitali Mohile
Active trader in the Indian stock markets since 2003 and a full-time writer. Trading is largely based upon technical analysis.
PRINT THIS ARTICLE
CHANNEL LINES
HAL In Ascending Channel
08/18/14 03:20:11 PMby Chaitali Mohile
The healthy rally of Halliburton Company stock offers good short-term trading opportunities.
Position: Sell
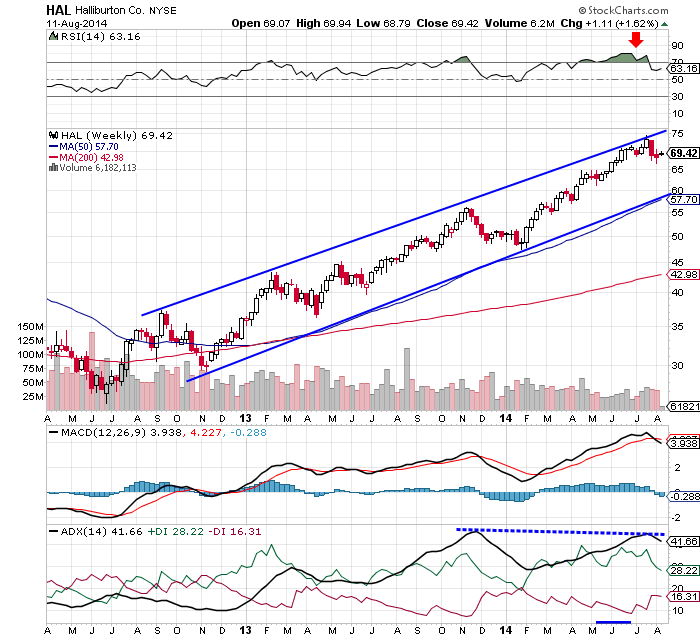
| Since mid-2012, Halliburton Company (HAL) has formed a series of higher highs and higher lows. The stock progressed with a steady bullish force and had the strong technical support of the 50-day moving average (MA). An ascending channel is formed by joining the higher peaks and higher bottoms as seen in Figure 1. The stock has been moving up steadily, thus making the upper and lower trendlines highly reliable. The stock has moved within the support-resistance trendlines on the weekly time frame chart in Figure 1. |
|
| FIGURE 1: HAL, WEEKLY. |
| Graphic provided by: StockCharts.com. |
| |
| Recently, HAL has once again hit the upper trendline resistance, forming a new high. Therefore, the stock is likely to follow the same price movement pattern. In addition, the average directional index, or ADX(14) has formed a double top in an overheated uptrend zone. This indicates the possibility of a trend reversal, confirming the downward price rally from the upper trendline resistance. The 14- period relative strength index, RSI(14) is overbought; hence it is likely to plunge a few levels to create room for a future price rally. The moving average convergence/divergence, (MACD) (12,26,9), is showing bearish crossover in positive territory. These conditions could add pressure on the stock. |
|
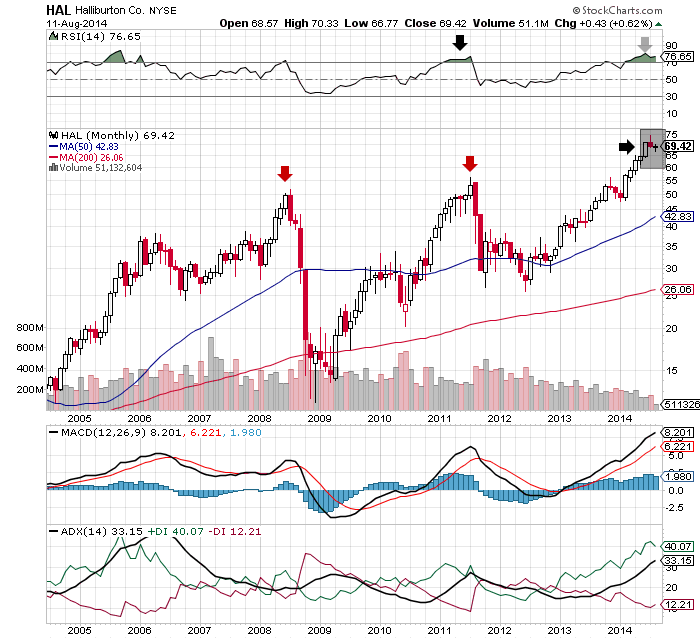
| FIGURE 2: HAL, MONTHLY. |
| Graphic provided by: StockCharts.com. |
| |
| On the monthly time frame chart in Figure 2, HAL has formed a small shooting star, which is a bearish reversal candlestick pattern. The RSI(14) is overbought and the MACD(12,26,9) is positive. These levels suggest a short-term bearish rally for HAL. The potential downside rally would be slow since the ADX(14) has not reached its overheated uptrend level. Such bearish reversal conditions had also occurred earlier (see arrow) on the monthly chart in Figure 2. Therefore, HAL could initiate its fresh short-term downside rally within the next few weeks. In the meantime, these bearish indications would increase the selling pressure, thus reversing the trend as well. |
| Hence it is likely that HAL will have a downside price rally. Therefore, traders can add this stock to their watchlist. The small downside rally could prompt you to open short positions for the smaller time period with low risk. The lower trendline of the ascending channel would be the ultimate support of the new rally. Once HAL establishes support at the lower trendline, traders can reverse their short position. HAL is a stock that could offer trading opportunities for long and short trades. |
Active trader in the Indian stock markets since 2003 and a full-time writer. Trading is largely based upon technical analysis.
| Company: | Independent |
| Address: | C1/3 Parth Indraprasth Towers. Vastrapur |
| Ahmedabad, Guj 380015 | |
| E-mail address: | chaitalimohile@yahoo.co.in |
Traders' Resource Links | |
| Independent has not added any product or service information to TRADERS' RESOURCE. | |
Click here for more information about our publications!
PRINT THIS ARTICLE

Request Information From Our Sponsors
- StockCharts.com, Inc.
- Candle Patterns
- Candlestick Charting Explained
- Intermarket Technical Analysis
- John Murphy on Chart Analysis
- John Murphy's Chart Pattern Recognition
- John Murphy's Market Message
- MurphyExplainsMarketAnalysis-Intermarket Analysis
- MurphyExplainsMarketAnalysis-Visual Analysis
- StockCharts.com
- Technical Analysis of the Financial Markets
- The Visual Investor
- VectorVest, Inc.
- Executive Premier Workshop
- One-Day Options Course
- OptionsPro
- Retirement Income Workshop
- Sure-Fire Trading Systems (VectorVest, Inc.)
- Trading as a Business Workshop
- VectorVest 7 EOD
- VectorVest 7 RealTime/IntraDay
- VectorVest AutoTester
- VectorVest Educational Services
- VectorVest OnLine
- VectorVest Options Analyzer
- VectorVest ProGraphics v6.0
- VectorVest ProTrader 7
- VectorVest RealTime Derby Tool
- VectorVest Simulator
- VectorVest Variator
- VectorVest Watchdog