

HOT TOPICS LIST
- MACD
- Fibonacci
- RSI
- Gann
- ADXR
- Stochastics
- Volume
- Triangles
- Futures
- Cycles
- Volatility
- ZIGZAG
- MESA
- Retracement
- Aroon
INDICATORS LIST
LIST OF TOPICS
PRINT THIS ARTICLE
by Billy Williams
With the overall market teetering on the edge of a correction, it's better to look at what stocks to sell -- starting with stock leaders like ACT
Position: Sell
Billy Williams
Billy Williams has been trading the markets for 27 years, specializing in momentum trading with stocks and options.
PRINT THIS ARTICLE
TECHNICAL ANALYSIS
Bowing Out Gracefully With ACT
08/14/14 04:39:27 PMby Billy Williams
With the overall market teetering on the edge of a correction, it's better to look at what stocks to sell -- starting with stock leaders like ACT
Position: Sell
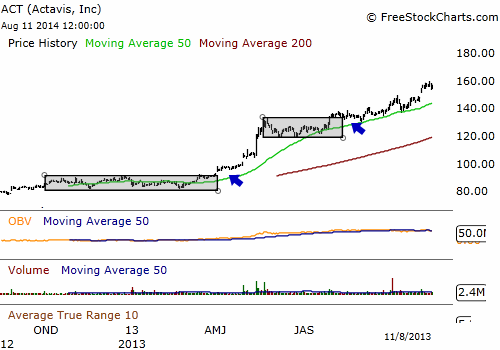
| The market has taken a beating lately which is leaving many traders scratching their heads on what to do next. The market's price action is still in a long-term bull trend but heavy distribution is adding up with a correction not far behind unless things fundamentally change. Short of that, now is not the time to be looking for your next long position, but to start playing defense. This is especially true for stocks like Actavis, or ACT, as stock leaders can decline faster than the general market by a factor of two or greater. Sentimentality and the stock market mix as well as oil and water with both scenarios leading to negative consequences for those foolish enough to try. Granted, it can be tough to "murder your darlings" when a stock has been a strong performer and added a few zeros to your bottom line, but objectivity is necessary. ACT has had a spectacular run since 2013 where it began forming a base in the form of a flat base chart pattern. From September of 2012 to the following April in 2013, ACT remained in a tight trading range until heavy volume pushed the stock higher above price resistance at the $93 level. On April 2, 2013, ACT exploded higher and formed a huge price gap on volume 30% of its 50-day average. Volume wasn't at the levels that you want to see normally for big breakouts but the huge price gap occurred outside the previous trading day which was actionable on its own and made for a actionable trade. |
|
| Figure 1. ACT emerged as a stock leader after forming two strong base patterns and then exploding higher. |
| Graphic provided by: www.freestockcharts.com. |
| |
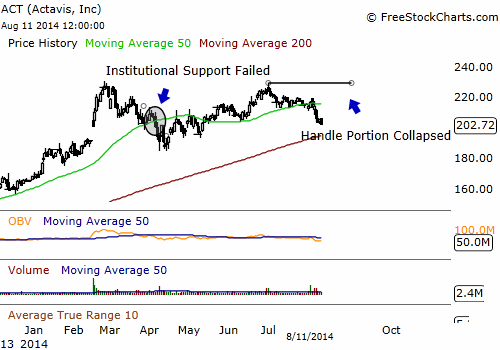
| From there, price surged more than 33% up to almost $133 where it peaked on May 22, 2013. Entering a period of price contraction, ACT traded near its new all-time high and found support at the $118-119 price point, forming a second base. On July 26, 2013, on volume almost double its 50-day average, ACT exploded higher through its resistance point and began a new bull run. Price action was strong, the trend firmly in the bulls' hands. Both the 50-day and 200-day SMA's were pointing northward as ACT made its ascent to higher territory as the stock made a steady series of higher highs and higher lows in its price action. After its breakout, for the next 6 months, the stock gained almost 100 points where it peaked at a new record high of $230.77 on February 26, 2014. Now the stock appears to have exhausted itself on the tail-end of a huge spike in volume that occurred on February 18, 2014 just prior to the new high. Adding to that, the stock began to decline to the point where it violated the 50-day SMA, a key indicator of institutional support. |
|
| Figure 2. After more than doubling in price from its first base breakout, ACT has stumbled recently. Breaking institutional support at its 50-day SMA and then failing to follow through its buy point on the handle portion of a cup & handle pattern that formed, ACT is signaling to get out on the eve of a potential market correction. |
| Graphic provided by: www.freestockcharts.com. |
| |
| There were those were hopeful that the stock would recover and resume its upward trend but third-stage bases rarely work out. After two successful base patterns, a cup & handle pattern formed during the third attempt of ACT to build a base but then the handle portion of the pattern failed to follow-through on a buy point of $230 and collapsed before even managing to muster a decent attempt at trading above it. Now, the general market is ratcheting up distribution days and is a stone's throw away from entering a correction. If that happens, strong performing stock leaders like ACT will lead the market in a decline since they are the first to feel the wrath of the bears when the market turns. Look to sell, or at least tighten up your stops, and put ACT back on your watchlist. When the tide begins to turn back in favor of the bulls then you can always buy back in ACT if it's still a viable candidate. If not, there are always more ACT's out there waiting to be discovered and lead the next bull rally. Better to focus your attention there for now. |
Billy Williams has been trading the markets for 27 years, specializing in momentum trading with stocks and options.
| Company: | StockOptionSystem.com |
| E-mail address: | stockoptionsystem.com@gmail.com |
Traders' Resource Links | |
| StockOptionSystem.com has not added any product or service information to TRADERS' RESOURCE. | |
Click here for more information about our publications!
Comments

Request Information From Our Sponsors
- StockCharts.com, Inc.
- Candle Patterns
- Candlestick Charting Explained
- Intermarket Technical Analysis
- John Murphy on Chart Analysis
- John Murphy's Chart Pattern Recognition
- John Murphy's Market Message
- MurphyExplainsMarketAnalysis-Intermarket Analysis
- MurphyExplainsMarketAnalysis-Visual Analysis
- StockCharts.com
- Technical Analysis of the Financial Markets
- The Visual Investor
- VectorVest, Inc.
- Executive Premier Workshop
- One-Day Options Course
- OptionsPro
- Retirement Income Workshop
- Sure-Fire Trading Systems (VectorVest, Inc.)
- Trading as a Business Workshop
- VectorVest 7 EOD
- VectorVest 7 RealTime/IntraDay
- VectorVest AutoTester
- VectorVest Educational Services
- VectorVest OnLine
- VectorVest Options Analyzer
- VectorVest ProGraphics v6.0
- VectorVest ProTrader 7
- VectorVest RealTime Derby Tool
- VectorVest Simulator
- VectorVest Variator
- VectorVest Watchdog