HOT TOPICS LIST
- MACD
- Fibonacci
- RSI
- Gann
- ADXR
- Stochastics
- Volume
- Triangles
- Futures
- Cycles
- Volatility
- ZIGZAG
- MESA
- Retracement
- Aroon
INDICATORS LIST
LIST OF TOPICS
PRINT THIS ARTICLE
by Donald W. Pendergast, Jr.
Shares of Tesla have been trending higher since their May 2014 low, but now face strong resistance levels.
Position: N/A
Donald W. Pendergast, Jr.
Freelance financial markets writer and online publisher of the Trendzetterz.com S&P 500 Weekly Forecast service.
PRINT THIS ARTICLE
SUPPORT & RESISTANCE
TSLA: Major Resistance
08/13/14 04:17:10 PMby Donald W. Pendergast, Jr.
Shares of Tesla have been trending higher since their May 2014 low, but now face strong resistance levels.
Position: N/A
| Tesla Motors (TSLA) surely appears to have a profitable long term future, with excellent fundamentals and an innovative, highly creative CEO at the helm; its share price generally reflects these dynamics, but like every other long term growth stock, there will be times of weakness following especially exuberant rallies. The current three month rally in TSLA is now stalling — at least temporarily — at a major resistance level and further declines toward 250.00 should be seen soon. Here's a closer look now. |

|
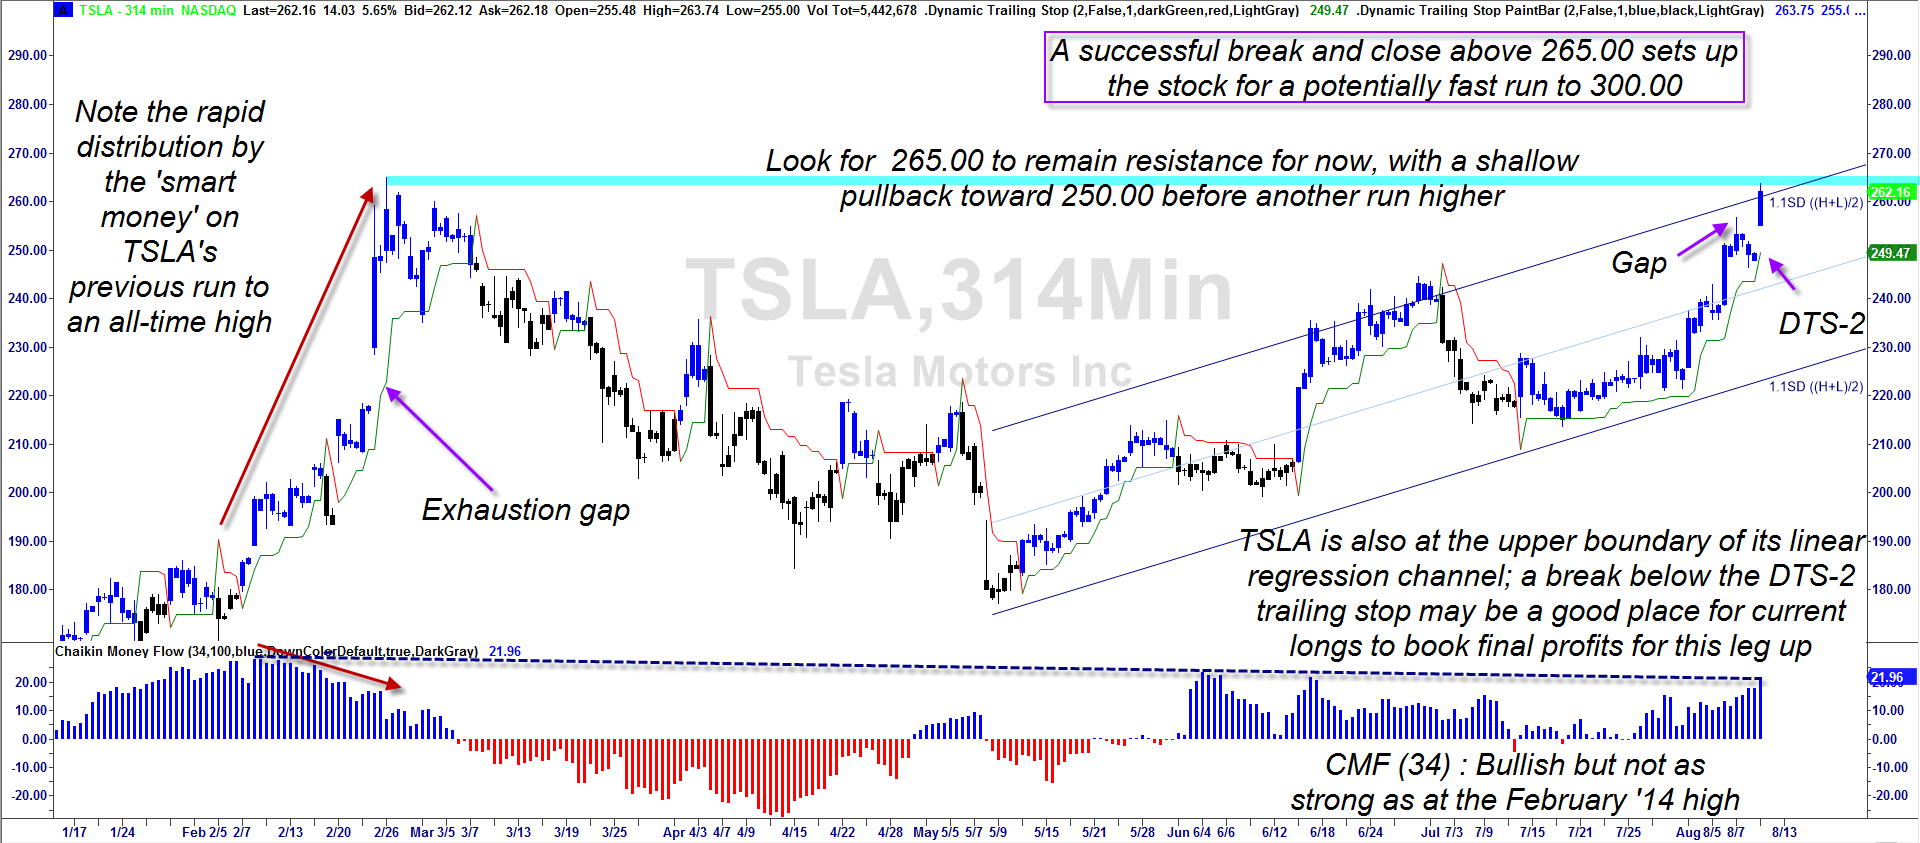
| Figure 1. Tesla Motors (TSLA): This stock is near two key resistance levels formed by the prior high and the upper channel line; medium term money flow also depicts some distribution underway. |
| Graphic provided by: TradeStation. |
| Graphic provided by: Dynamic Trailing Stop by Fibozachi.com. |
| |
| While Tesla Motors (TSLA) can make lots of highly volatile, swing moves within its longer term trends, it's still a worthwhile stock to include in an equity trading portfolio. The big idea is to locate major support/resistance zones in advance and then wait for a high probability breakout, trailing it with a fairly wide stop as the move (generally) plays out. Note how TSLA's short trades between late February 2014 and mid-May 2014 weren't very profitable when a close trailing stop was employed, but the opposite case was true on the three major bullish trend thrusts within the linear regression channel seen since the end of May 2014, even though the stop was based on the same standard deviation calculation. One of the reasons for this is that TSLA is still in a major secular bull market, and short trades rarely work out when a hot, widely followed issue like this one begins to catch a bid from the big money players in the market; the exception here is at major trend reversals, of course. Short sales work great after a stock goes parabolic, stalls, reverses lower and finally goes into free-fall, but that simply won't be enough to make up for all the short sale losses incurred on the way to the top by permabear or impatient traders. Also, for what it's worth, my own extensive testing of trading systems since 1999 confirms that most stocks offer very little profit opportunity on the short side (except at major tops, as mentioned before) and that most traders should simply design (or buy) and trade their systems from the long side only. One of my best systems trades Netflix (NFLX)) and although it does manage to make a decent profit on the short side, the long side is clearly the side to focus on. That said, TSLA still has a strong bullish trend going; the bullish channel on this 314-minute chart shows little reason to panic; in fact, it appears that the stock is determined to make it back to — if not exceed — its February 2014 all-time high of 265.00 (blue horizontal line). There are a few obstacles to overcome, however: 1. TSLA has hit the upper boundary of its regression channel at the time of a multicycle high. 2. The stock came within $1.30 of its all-time high of 265.00 on August 11, 2014, reversing lower to close at 259.01, indicating professional profit taking. 3. Medium term Chaikin Money Flow (CMF)(34) shows modest bearish divergence with two previous money flow histogram peaks; this also indicates distribution. 4. Finally, note the bullish gaps just before the attempt at the all-time high was made in late February and the one that just printed recently; this yet another warning that the smart money is using rallies to sell out — they gap it higher to sell out to latecomers hoping for a new high soon. |

|
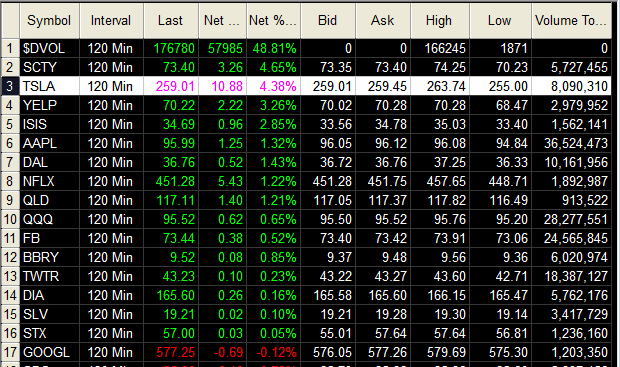
| Figure 2. TSLA was up by nearly 6% at one point on August 11, 2104; the rally was broad based, with NYSE up volume nearly 2.75 times greater than down volume. |
| Graphic provided by: TradeStation. |
| Graphic provided by: TradeStation RadarScreen. |
| |
| In the near term, expect TSLA to take a breather, possibly taking out the DTS-2 trail (currently at 249.47) and making a support test of the regression channel mid-line near 245.00 before attracting fresh buying power and heading back up toward 265.00 again. Longer term money flows remain very bullish, almost guaranteeing a nice bounce after such a pullback. The 245.00/250.00 area could be a great place to put on a long swing trade to take advantage of this high probability event, assuming the 245.00 area holds as support, of course. Account risk on such a trade should be kept near 1% since the broad market is so vulnerable to the start of a major decline within the next month or so. Trade wisely until we meet here again. |
Freelance financial markets writer and online publisher of the Trendzetterz.com S&P 500 Weekly Forecast service.
| Title: | Market consultant and writer |
| Company: | Trendzetterz |
| Address: | 81 Hickory Hollow Drive |
| Crossville, TN 38555 | |
| Phone # for sales: | 904-303-4814 |
| Website: | trendzetterz.com |
| E-mail address: | support@trendzetterz.com |
Traders' Resource Links | |
| Trendzetterz has not added any product or service information to TRADERS' RESOURCE. | |
Click here for more information about our publications!
Comments

Request Information From Our Sponsors
- StockCharts.com, Inc.
- Candle Patterns
- Candlestick Charting Explained
- Intermarket Technical Analysis
- John Murphy on Chart Analysis
- John Murphy's Chart Pattern Recognition
- John Murphy's Market Message
- MurphyExplainsMarketAnalysis-Intermarket Analysis
- MurphyExplainsMarketAnalysis-Visual Analysis
- StockCharts.com
- Technical Analysis of the Financial Markets
- The Visual Investor
- VectorVest, Inc.
- Executive Premier Workshop
- One-Day Options Course
- OptionsPro
- Retirement Income Workshop
- Sure-Fire Trading Systems (VectorVest, Inc.)
- Trading as a Business Workshop
- VectorVest 7 EOD
- VectorVest 7 RealTime/IntraDay
- VectorVest AutoTester
- VectorVest Educational Services
- VectorVest OnLine
- VectorVest Options Analyzer
- VectorVest ProGraphics v6.0
- VectorVest ProTrader 7
- VectorVest RealTime Derby Tool
- VectorVest Simulator
- VectorVest Variator
- VectorVest Watchdog
