

HOT TOPICS LIST
- MACD
- Fibonacci
- RSI
- Gann
- ADXR
- Stochastics
- Volume
- Triangles
- Futures
- Cycles
- Volatility
- ZIGZAG
- MESA
- Retracement
- Aroon
INDICATORS LIST
LIST OF TOPICS
PRINT THIS ARTICLE
by Donald W. Pendergast, Jr.
Whenever the S&P 500 index makes a sharp, persistent correction, the volatility indexes can rally sharply.
Position: N/A
Donald W. Pendergast, Jr.
Freelance financial markets writer and online publisher of the Trendzetterz.com S&P 500 Weekly Forecast service.
PRINT THIS ARTICLE
VOLATILITY
VXX: Will Volatility Continue To Spike?
08/13/14 03:57:17 PMby Donald W. Pendergast, Jr.
Whenever the S&P 500 index makes a sharp, persistent correction, the volatility indexes can rally sharply.
Position: N/A
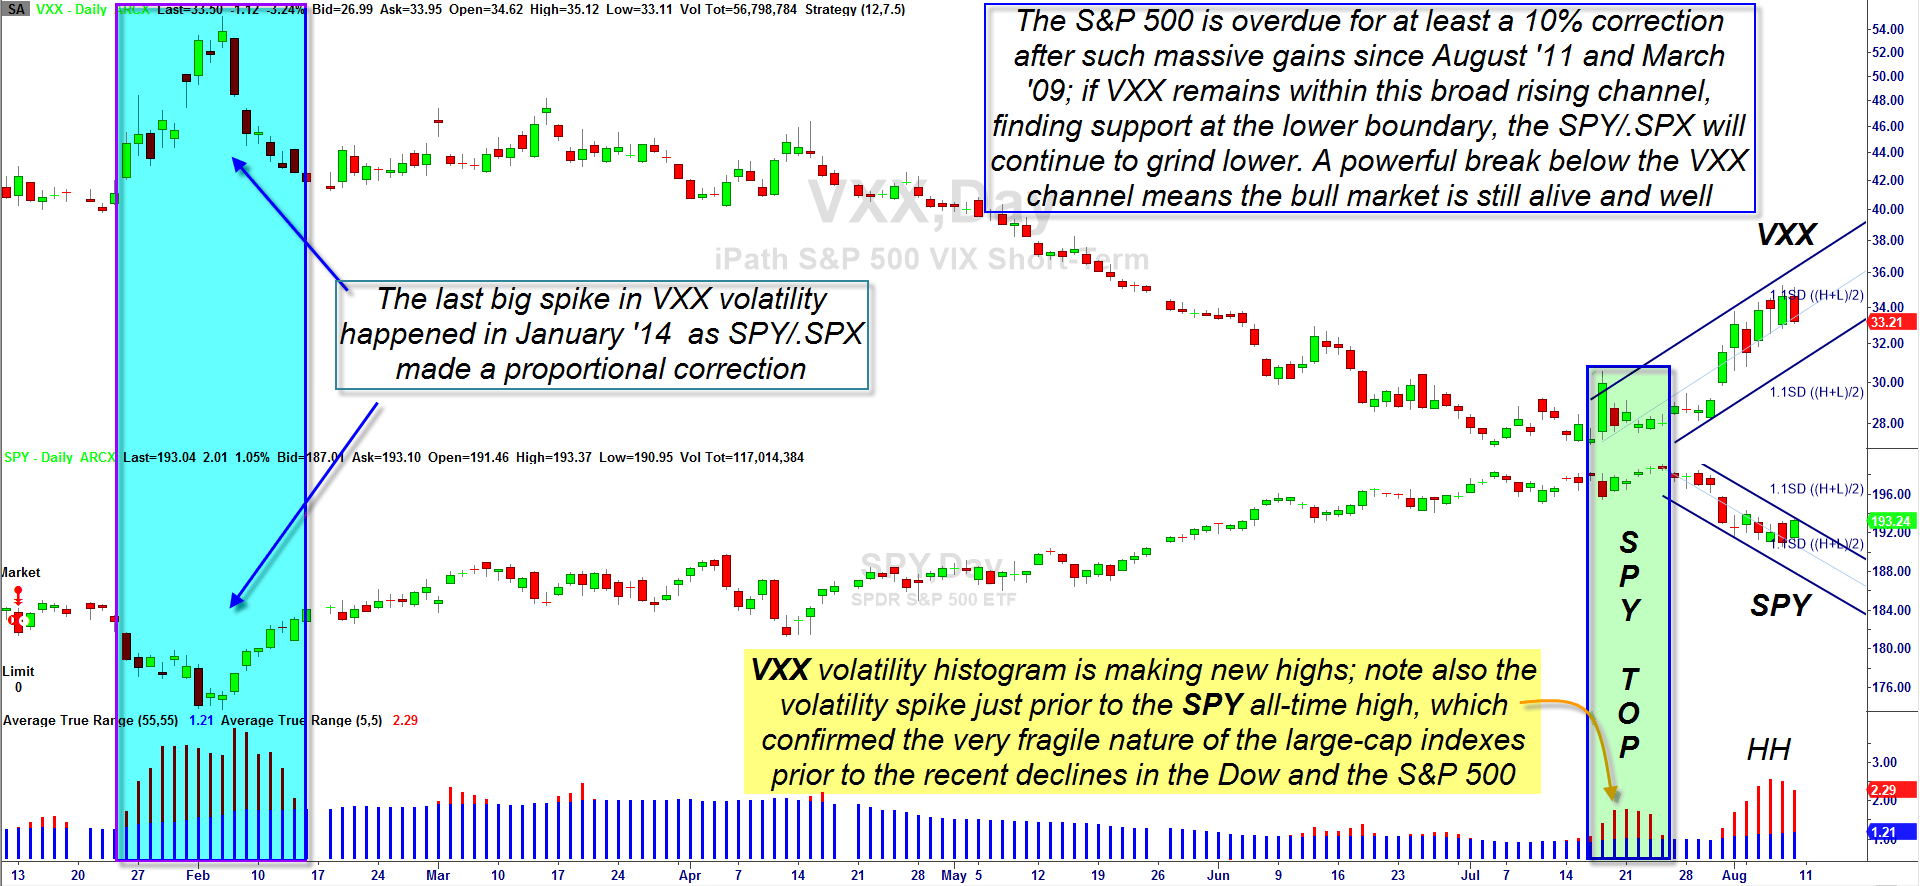
| Trading volatility in the S&P 500 index (.SPX, SPY) has always been of great interest among option traders, but stock traders can also get in on this action by trading ticker symbols VXX (iPath S&P 500 VIX Short Term) and XIV (VS Inverse VIX Short Term). Most times, especially when the .SPX is in a relatively strong uptrend, VXX will slowly decline and XIV will gradually grind higher; when you see this, you can be confident that traders and investors feel safe, without great fear of a sudden correction. But now, just as we saw in January of this year, VXX has begun a powerful rally, one that actually started a week before .SPX/SPY made their respective all-time highs on July 24, 2014. That was perhaps the early warning signal that implied that the correction we are now experiencing will ultimately become something far bigger than anything we've seen since the summer of 2011. Here's a closer look now. |
|
| Figure 1. iPath S&P 500 VIX Short-Term (VXX) and SPDR S&P 500 ETF (SPY) move inversely to each other. If retail investors start to panic again as they did in 2000 and 2007, expect the current spread between these two financial instrument to widen by a much larger amount over the next 6 to 12 months. |
| Graphic provided by: TradeStation. |
| |
| The daily chart shows VXX on top and SPY on the bottom; obviously, each instrument moves inversely to each other, and sometimes at differing rates of speed, especially because VXX is a derivative of VIX futures and futures option values, which can experience violent expansions/contractions in value whenever a new wave of positive/negative global news events hit the financial market. Like other sharp price moves in the markets, sometimes things get a bit overdone and then return to more normal values in due time. However, the latest spike in VXX is worrisome for the bulls because it occurred a full week before the top was made in late July 2014; this seems to have been a sure sign that the so-called "smart money" interests in the market (mutual funds, banks, pension and hedge funds) were going into an even heavier round of distribution than previously seen. Now, of course all of the bad news from Ukraine and the Mid-East since early July 2014 was a factor here, but only as precipitating (triggering) events that set off a decline that was long overdue anyway. The question now is how far down the .SPX/SPY will fall and how high VXX will make it on this latest hiccup in the broad US markets. Here are some things to consider which may provide some insights in this regard: 1.The last time the .SPX had a 20% or greater correction was between May/September 2011. 2. The bull market of 2009-2014 has traveled upward at a higher rate of speed and a greater angle of attack than the 2003-2007 bull market and now is at fundamentally and technically unsustainable levels; any experienced technician who has seen and survived the numerous bull/bear markets since the early 70s already knows this to be true. 3. Cycle studies and Elliot Wave studies suggest we are now at a major top in the broad US markets. This is not the time to get aggressive on the long side in US equities. |
|
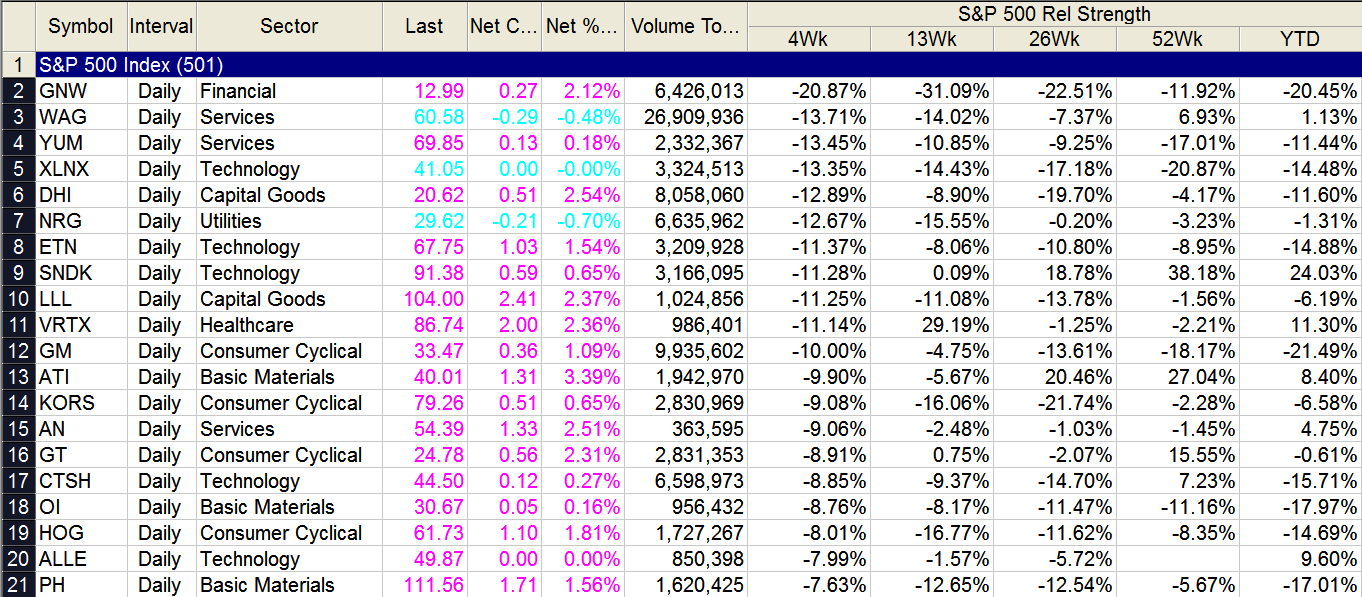
| Figure 2. Here are the twenty weakest stocks in the S&P 500 index (.SPX), based on their 4-week comparative relative strength ranking; note the heavy Technology sector representation. |
| Graphic provided by: TradeStation. |
| Graphic provided by: TradeStation RadarScreen. |
| |
| The .SPX tested a key support level last week at 1,897.75; a weekly close below that immediately sets up a quick decline to the next support at 1,844.58 which is a key long term linear regression channel support. Expect this level to be reached within two weeks — or less — if/when we see that weekly close below 1,897.75. Given the magnitude of the bull run since '09, this would be a great time to use weekly charts instead of daily ones, as the size of the correction now anticipated requires the use of weekly/monthly based support levels and price targets. Traders can also monitor the progress of VXX within its daily/weekly price channel; breaks below key support in VXX can leads to rapid declines, so keep close watch on its daily/weekly price action. Another major support level resides at 1,764.83, and we may also see that price level hit very quickly as the herd starts to panic as they did in 2000 and 2007 — get ready! If you don't trade volatility-related instruments, focus instead on the weakest relative strength .SPX issues; you can see the 20 worst 4-week comparative relative strength stocks vs. the .SPX on the RadarScreen above in Figure 2; note that the Technology sector alone has five stocks listed, and this is a true heads-up to those with heavy long tech exposure now. If you are a long term buy-and-holder, by all means get your protective puts in place now, before .SPX breaks the next support level. Speculative bears should seek out low risk long put plays in weak RS large caps, being sure to note all key support areas in advance so as to set rational profit targets as the various sectors begin to disintegrate further. This is a time to exercise extreme caution and discretion in the markets, for retail and professional traders alike; so pick your stocks, options and indexes wisely in the days, weeks and months ahead. Trade wisely until we meet here again. |
Freelance financial markets writer and online publisher of the Trendzetterz.com S&P 500 Weekly Forecast service.
| Title: | Market consultant and writer |
| Company: | Trendzetterz |
| Address: | 81 Hickory Hollow Drive |
| Crossville, TN 38555 | |
| Phone # for sales: | 904-303-4814 |
| Website: | trendzetterz.com |
| E-mail address: | support@trendzetterz.com |
Traders' Resource Links | |
| Trendzetterz has not added any product or service information to TRADERS' RESOURCE. | |
Click here for more information about our publications!
PRINT THIS ARTICLE

Request Information From Our Sponsors
- StockCharts.com, Inc.
- Candle Patterns
- Candlestick Charting Explained
- Intermarket Technical Analysis
- John Murphy on Chart Analysis
- John Murphy's Chart Pattern Recognition
- John Murphy's Market Message
- MurphyExplainsMarketAnalysis-Intermarket Analysis
- MurphyExplainsMarketAnalysis-Visual Analysis
- StockCharts.com
- Technical Analysis of the Financial Markets
- The Visual Investor
- VectorVest, Inc.
- Executive Premier Workshop
- One-Day Options Course
- OptionsPro
- Retirement Income Workshop
- Sure-Fire Trading Systems (VectorVest, Inc.)
- Trading as a Business Workshop
- VectorVest 7 EOD
- VectorVest 7 RealTime/IntraDay
- VectorVest AutoTester
- VectorVest Educational Services
- VectorVest OnLine
- VectorVest Options Analyzer
- VectorVest ProGraphics v6.0
- VectorVest ProTrader 7
- VectorVest RealTime Derby Tool
- VectorVest Simulator
- VectorVest Variator
- VectorVest Watchdog