HOT TOPICS LIST
- MACD
- Fibonacci
- RSI
- Gann
- ADXR
- Stochastics
- Volume
- Triangles
- Futures
- Cycles
- Volatility
- ZIGZAG
- MESA
- Retracement
- Aroon
INDICATORS LIST
LIST OF TOPICS
PRINT THIS ARTICLE
by Gary Grosschadl
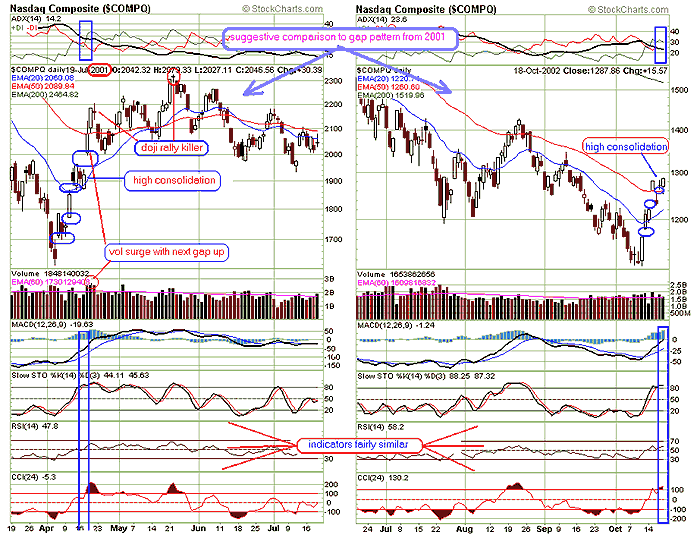
These Nasdaq gaps look familiar-- the spring of 2001 showed a similar chart situation. How much of this pattern will repeat?
Position: N/A
Gary Grosschadl
Independent Canadian equities trader and technical analyst based in Peterborough
Ontario, Canada.
PRINT THIS ARTICLE
CHART ANALYSIS
Will Nasdaq Gap History Repeat?
10/21/02 08:47:52 AMby Gary Grosschadl
These Nasdaq gaps look familiar-- the spring of 2001 showed a similar chart situation. How much of this pattern will repeat?
Position: N/A
| The Nasdaq index has a colorful history of gaps and even those "doji rally killers" that I have pointed out several times in the past. These gapping plays often get ahead of themselves but do show very bullish momentum. The chart depicting the 2001 pattern illustrated a very bullish pattern of four upward gaps. These led to a couple of normal retracements before a doji "rally killer" finally appeared warning of a likely downtrend. The impressive feature was an advance of about 700 points since that bottom before the top was hit, including a 300 point advance above the series of four gaps. Of course the longer term outcome did result in each of those gaps eventually being filled to the downside. |
| Presently the Nasdaq shows a series of three bullish gaps and IF history repeats...this implies enough bullish momentum to carry it further still, at least in the shorter term. |

|
| Graphic provided by: stockcharts.com. |
| |
| Events to watch for going forward are another advance on increasing volume and a normal retracement or two before hitting a top marked by an ominous candlestick warning. This is a bullish view based on the pattern of upside gaps showing some impressive bullish momentum. Traders should remain alert to whatever evolves going forward. |
Independent Canadian equities trader and technical analyst based in Peterborough
Ontario, Canada.
| Website: | www.whatsonsale.ca/financial.html |
| E-mail address: | gwg7@sympatico.ca |
Click here for more information about our publications!
Comments
Date: 10/22/02Rank: 5Comment:
Date: 10/22/02Rank: 4Comment: An interesting note on the 3 gap correlation
Date: 10/22/02Rank: 3Comment:
Date: 10/24/02Rank: 4Comment:

Request Information From Our Sponsors
- StockCharts.com, Inc.
- Candle Patterns
- Candlestick Charting Explained
- Intermarket Technical Analysis
- John Murphy on Chart Analysis
- John Murphy's Chart Pattern Recognition
- John Murphy's Market Message
- MurphyExplainsMarketAnalysis-Intermarket Analysis
- MurphyExplainsMarketAnalysis-Visual Analysis
- StockCharts.com
- Technical Analysis of the Financial Markets
- The Visual Investor
- VectorVest, Inc.
- Executive Premier Workshop
- One-Day Options Course
- OptionsPro
- Retirement Income Workshop
- Sure-Fire Trading Systems (VectorVest, Inc.)
- Trading as a Business Workshop
- VectorVest 7 EOD
- VectorVest 7 RealTime/IntraDay
- VectorVest AutoTester
- VectorVest Educational Services
- VectorVest OnLine
- VectorVest Options Analyzer
- VectorVest ProGraphics v6.0
- VectorVest ProTrader 7
- VectorVest RealTime Derby Tool
- VectorVest Simulator
- VectorVest Variator
- VectorVest Watchdog
