HOT TOPICS LIST
- MACD
- Fibonacci
- RSI
- Gann
- ADXR
- Stochastics
- Volume
- Triangles
- Futures
- Cycles
- Volatility
- ZIGZAG
- MESA
- Retracement
- Aroon
INDICATORS LIST
LIST OF TOPICS
PRINT THIS ARTICLE
by Koos van der Merwe
Christmas is four months away; is it time to buy shares of a toy company?
Position: Buy
Koos van der Merwe
Has been a technical analyst since 1969, and has worked as a futures and options trader with First Financial Futures in Johannesburg, South Africa.
PRINT THIS ARTICLE
ELLIOTT WAVE
Mattel, The Toy Company
08/12/14 04:46:59 PMby Koos van der Merwe
Christmas is four months away; is it time to buy shares of a toy company?
Position: Buy
| There's no time to toy around at Mattel (MAT). The toy-maker posted disappointing quarterly results last Thursday morning, weighed down by a 9% decline in worldwide sales. There was a 15% drop in Barbie sales, and a 17% plunge at Fisher-Price. It looks as if toys have fallen out of favor with today's computer addicted toddlers. This is now the third quarter in a row where Mattel has fallen short of Wall Street's profit expectations. Are they going to re-invent themselves? Is the Barbie doll history or is she being reborn? |

|
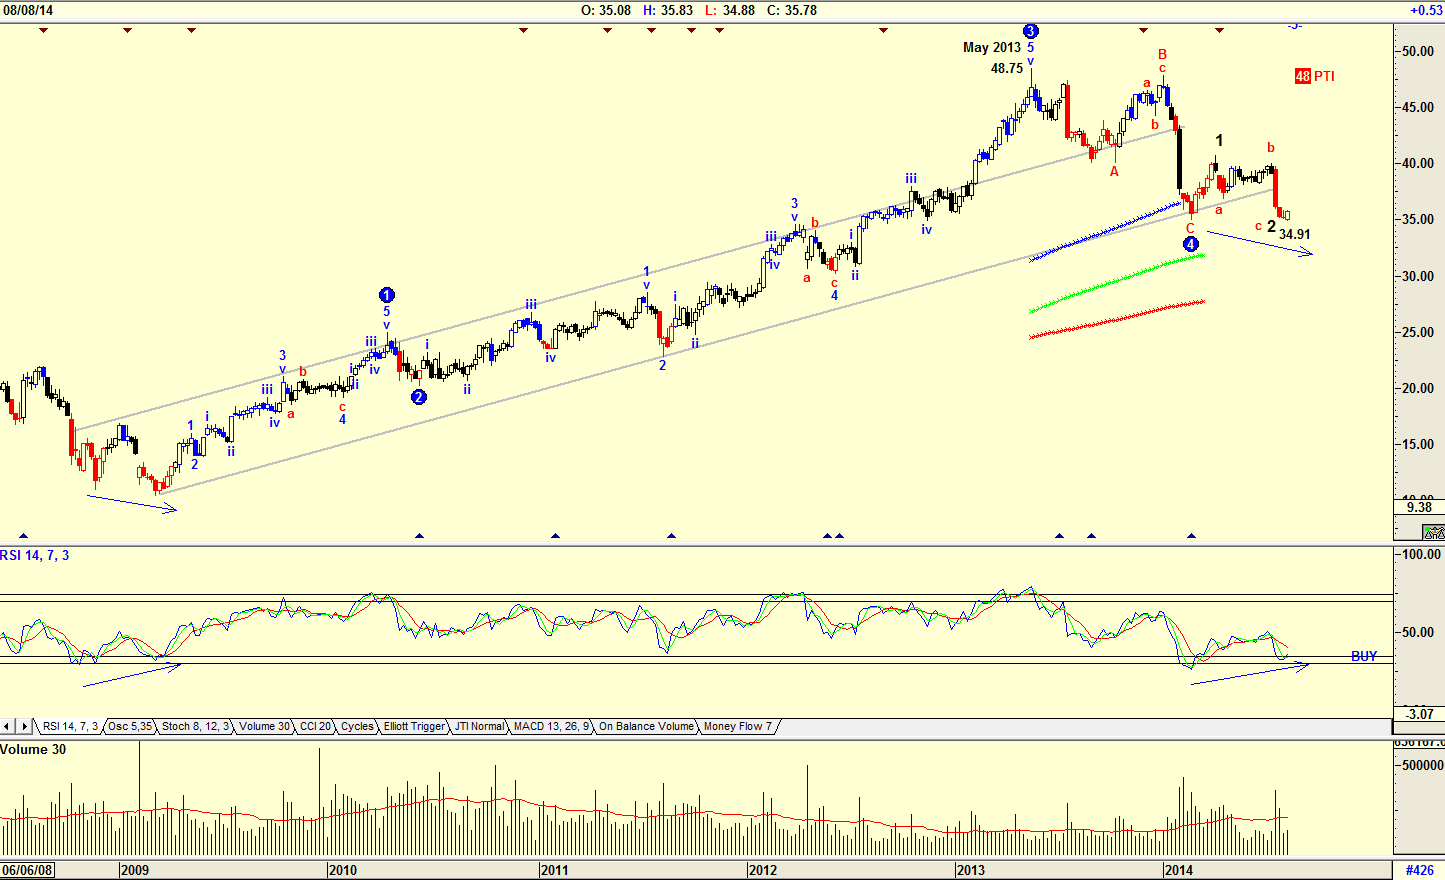
| Figure 1. Weekly chart with Elliott wave count. |
| Graphic provided by: AdvancedGET. |
| |
| The chart in Figure 1 is a weekly chart of Mattel showing how the share price has fallen from a high of $48.75 in May 2013 to its present low of $34.91. The Elliott wave count suggests that the share should now start rising in in a Wave 3 of WAVE 5. The RSI indicator is suggesting a buy divergence signal. A divergence buy signal is where the RSI indicator makes a higher low while the share price makes a lower low as shown by the arrows on the chart. |

|
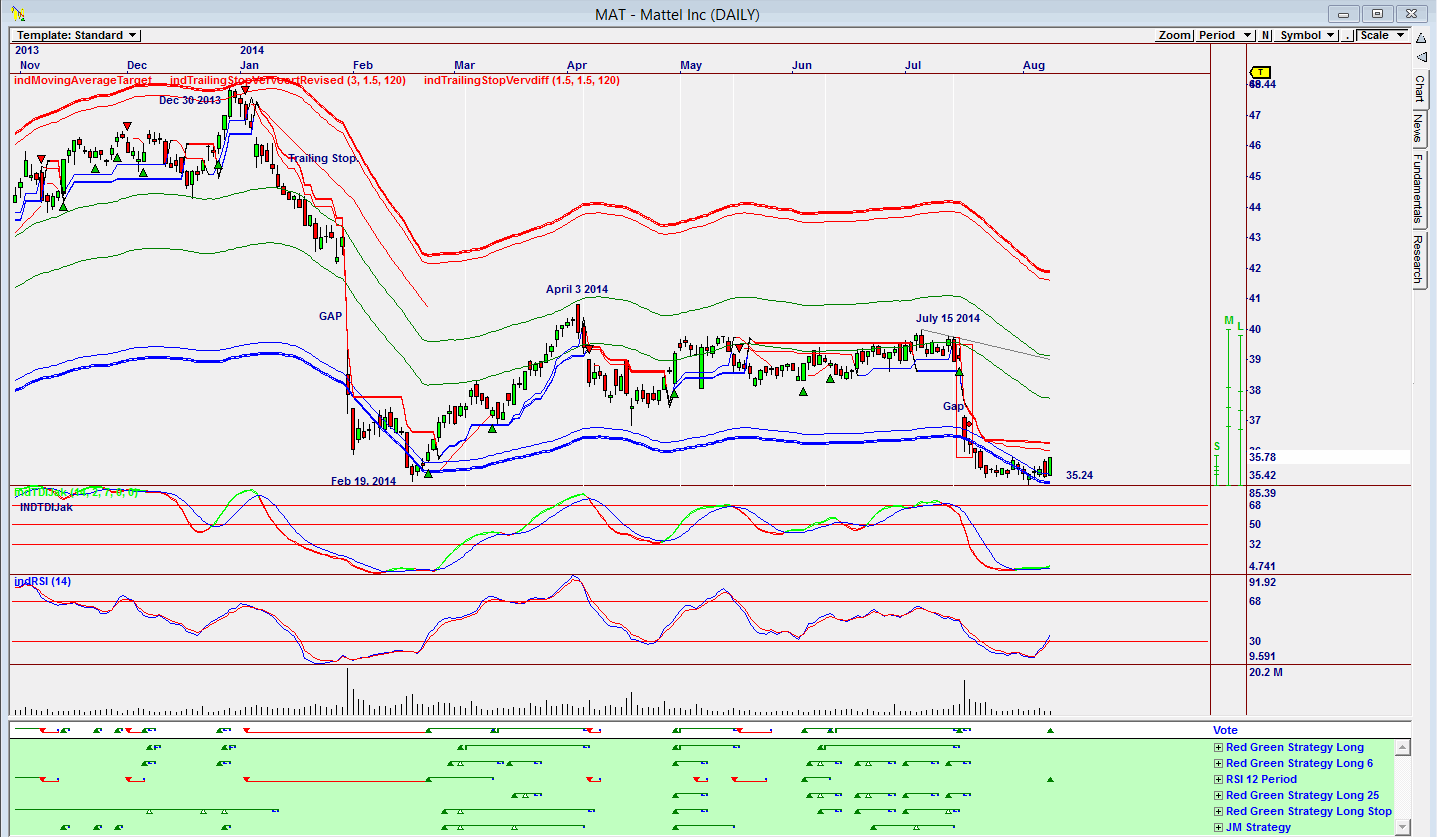
| Figure 2. Daily chart showing buy signal. |
| Graphic provided by: Omnitrader.. |
| |
| The chart in Figure 2 is an Omnitrader chart that brought Mattel to my attention. The chart shows how the share price has fallen from its high on December 30th, 2013 to its low by February 19th, 2014 — and on a gap. The fall was because the results of Christmas sales were below expectations. The share price then rose to fill the gap, but then moved sideways. On July 15th, 2014 the price once again fell and on a gap to a low of $35.24 because, once again, sales were poor. Note the buy and sell signals suggested on the Vote line which have been signals worth following. The Vote line has given a fresh buy signal based on the RSI12 strategy. The IndTDIJak indicator is also suggesting a buy signal. Buying a well known company that has fallen on hard times is often a risk worth taking. One has only to remember Apple and Starbucks. The risk, of course, is always a Blackberry — will the company be able to re-invent itself? I would be a buyer of Mattel shares at the present price, based purely on the weekly Elliott wave chart that is suggesting a rise in a Wave 5, and on the daily chart which has given a buy signal, but I would keep my stop loss close. |
Has been a technical analyst since 1969, and has worked as a futures and options trader with First Financial Futures in Johannesburg, South Africa.
| Address: | 3256 West 24th Ave |
| Vancouver, BC | |
| Phone # for sales: | 6042634214 |
| E-mail address: | petroosp@gmail.com |
Click here for more information about our publications!
PRINT THIS ARTICLE

|

Request Information From Our Sponsors
- StockCharts.com, Inc.
- Candle Patterns
- Candlestick Charting Explained
- Intermarket Technical Analysis
- John Murphy on Chart Analysis
- John Murphy's Chart Pattern Recognition
- John Murphy's Market Message
- MurphyExplainsMarketAnalysis-Intermarket Analysis
- MurphyExplainsMarketAnalysis-Visual Analysis
- StockCharts.com
- Technical Analysis of the Financial Markets
- The Visual Investor
- VectorVest, Inc.
- Executive Premier Workshop
- One-Day Options Course
- OptionsPro
- Retirement Income Workshop
- Sure-Fire Trading Systems (VectorVest, Inc.)
- Trading as a Business Workshop
- VectorVest 7 EOD
- VectorVest 7 RealTime/IntraDay
- VectorVest AutoTester
- VectorVest Educational Services
- VectorVest OnLine
- VectorVest Options Analyzer
- VectorVest ProGraphics v6.0
- VectorVest ProTrader 7
- VectorVest RealTime Derby Tool
- VectorVest Simulator
- VectorVest Variator
- VectorVest Watchdog
