

HOT TOPICS LIST
- MACD
- Fibonacci
- RSI
- Gann
- ADXR
- Stochastics
- Volume
- Triangles
- Futures
- Cycles
- Volatility
- ZIGZAG
- MESA
- Retracement
- Aroon
INDICATORS LIST
LIST OF TOPICS
PRINT THIS ARTICLE
by Donald W. Pendergast, Jr.
Shares of Apple, Inc. jumped by 30% between April and July of this year; now comes the proportional correction to support.
Position: N/A
Donald W. Pendergast, Jr.
Freelance financial markets writer and online publisher of the Trendzetterz.com S&P 500 Weekly Forecast service.
PRINT THIS ARTICLE
FIBONACCI
AAPL: Bearish Reversal Commences
08/12/14 04:37:55 PMby Donald W. Pendergast, Jr.
Shares of Apple, Inc. jumped by 30% between April and July of this year; now comes the proportional correction to support.
Position: N/A
| These are truly remarkable times in the US stock markets; global tensions are at the most strained level since the Eurozone crisis of 2011 and yet the broad markets continue to hold on to the vast majority of the gains seen over the last 5 1/2 years of a record bull run. Shares of Apple, Inc. (AAPL) are still within 5% of their September 2012 all-time high and recent rallies have been impressive, which is a big reason why the S&P 500 index is still so buoyant in a world filled with war, economic worries and plenty of other woes. But every strong trend needs a rest, even those seen in AAPL, and the stock is now entering the first leg down of a correction of uncertain degree. Here's a look at AAPL's daily chart along with a few ideas on how to play the current weakness in the shares. |
|
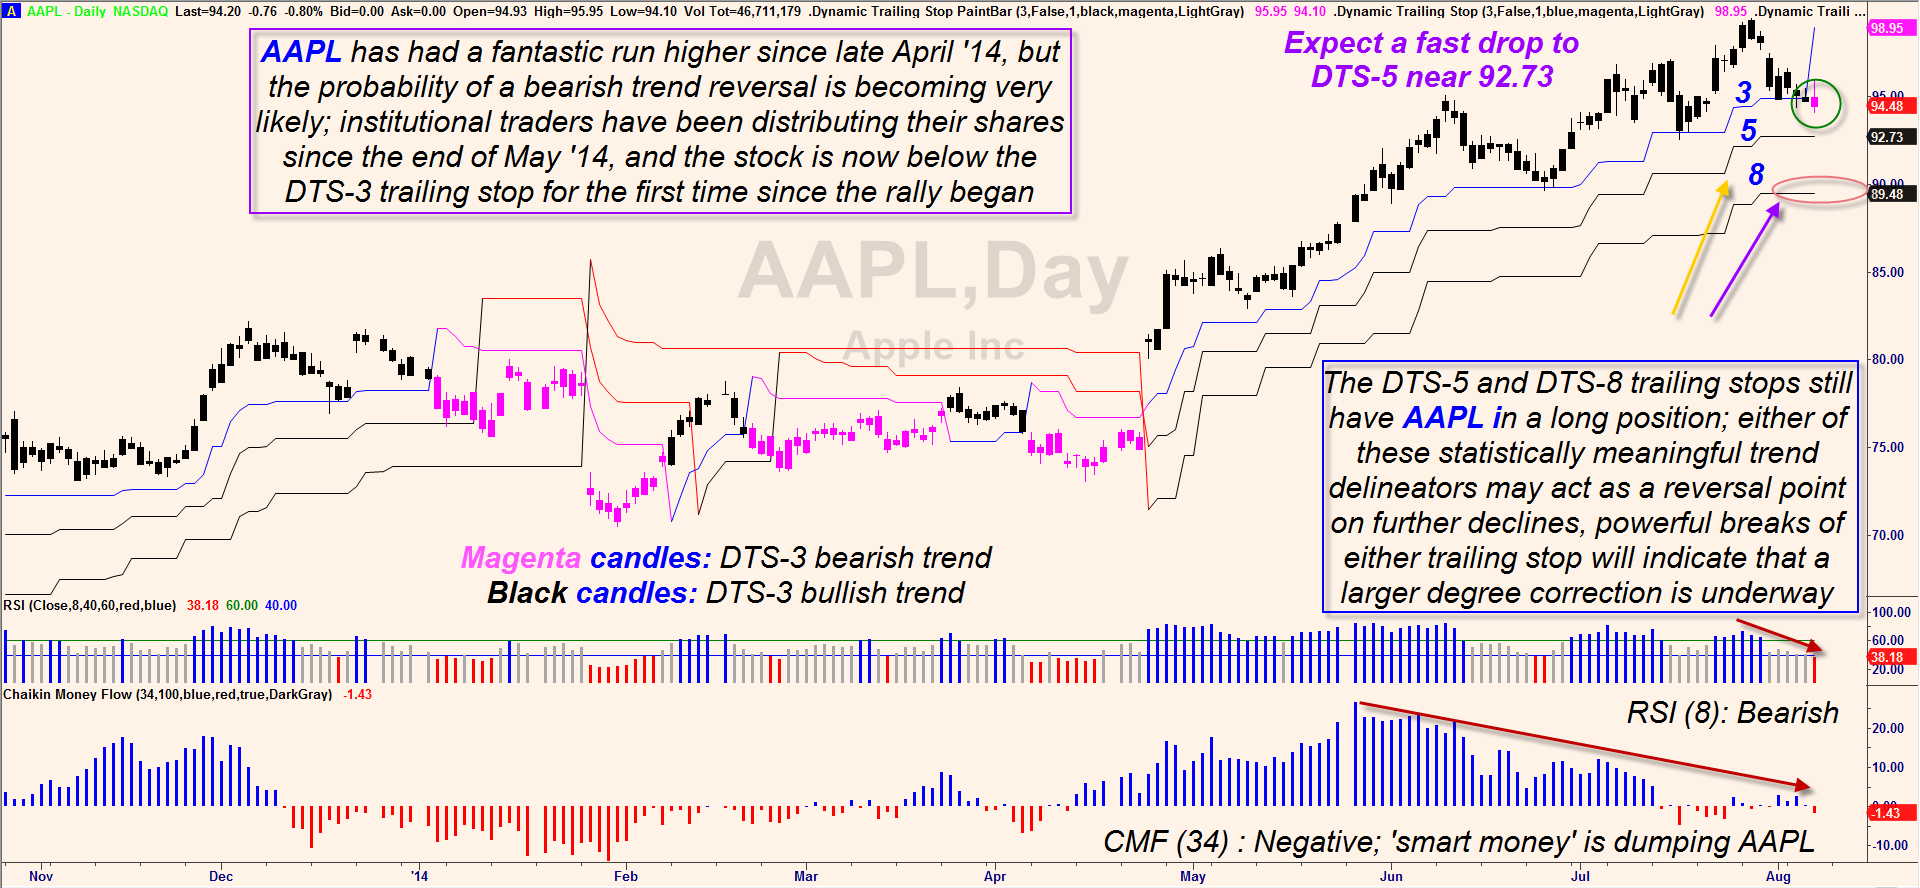
| Figure 1. Apple, Inc. (AAPL) prepares to correct further after a 30% spring/summer rally; the next trailing stop supports are found at 92.43 and 89.48, respectively. |
| Graphic provided by: TradeStation. |
| Graphic provided by: Dynamic Trailing Stop by Fibozachi.com. |
| |
| AAPL made the transition from spring to summer in fine style, staging a massive bullish breakout on April 24, 2014 that saw it break above three consecutive trailing stop levels in one shot; the bullish gap allowed AAPL to take out the underside of DTS-3 (Dynamic Trailing Stop), DTS-5 and DTS-8 in a single day, and the stock never looked back, surging for the next 14 weeks as it rallied from 74.92 to 99.44. AAPL stayed on the bullish side of all three trailing stops until DTS-3 was taken out on August 7, 2014; the daily candles changed from black to magenta as this occurred. The big question now, of course, is just how much lower AAPL will decline until it hits a price level attractive enough to draw the "smart money" (institutional traders) back on board. Here are several items to consider toward that end: 1. Based on the 34-day Chaikin Money Flow histogram (CMF)(34), institutional traders began distributing their shares in AAPL starting in late May and they didn't stop; the July 2014 rally was their big opportunity to draw another batch of latecomers into the stock, allowing them to make a graceful exit and a nice chunk of change. 2. The July 2014 swing high, as it stands now, is a failure swing as it did not have the strength to rise to the all-time high of 100.72 set in September 2012. 3. The 8-period RSI has just dropped below 40.00 for the first time in 6 weeks, yet another high probability warning that more declines await this issue. 4. The Market Vectors Semiconductors ETF (SMH) is actually a bit ahead of AAPL in its own sell-off; like AAPL, it is very likely to drop further in the next week or two, with both able to find a new DTS trailing stop a few percent more below where they are now. Key DTS supports for AAPL and SMH: AAPL: DTS-5 @ 92.73 and DTS-8 @ 89.48 SMH: DTS-13 @ 46.94 The big idea with the DTS trailing stops is that they are effective at trailing a wide variety of swing/trend moves and that they also frequently act as powerful support/resistance (S/R) levels in an ongoing trend; such S/R areas can be places to consider an add-on to existing long (short) positions, all else being equal. |
|
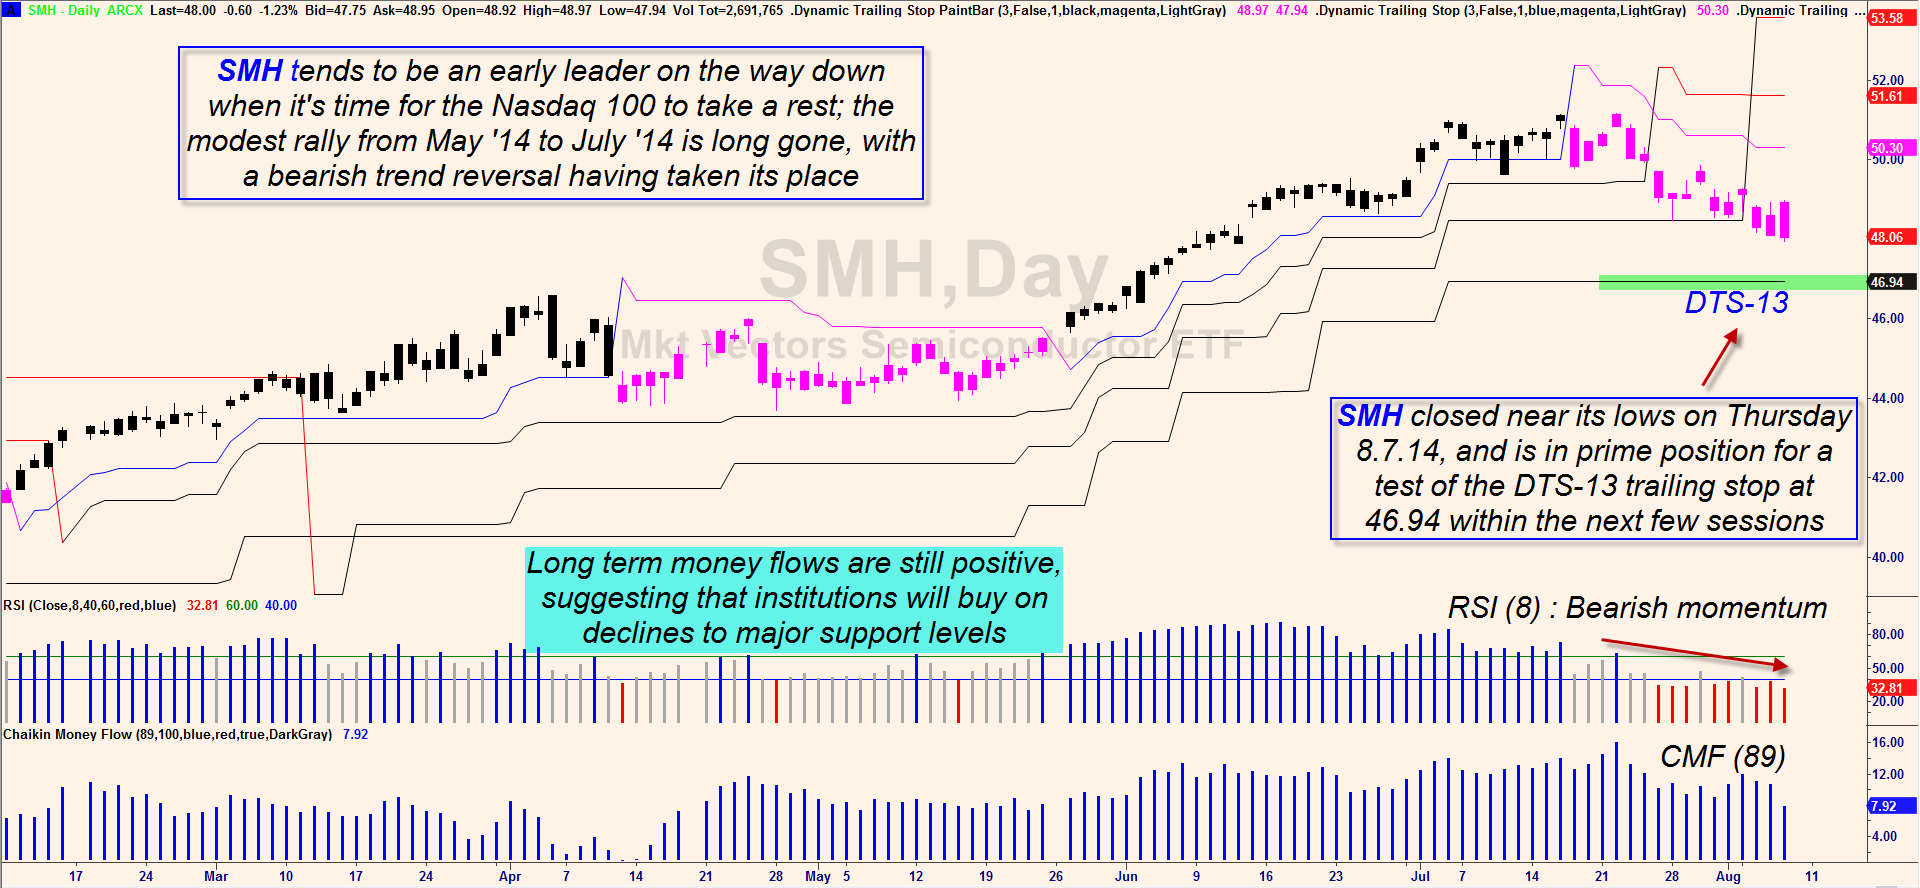
| Figure 2. The Market Vectors Semiconductor ETF (SMH) peaked a week before AAPL did and has already broken three trailing stop levels since then. The next trailing stop level is DTS-13 at a price level of 46.94. |
| Graphic provided by: TradeStation. |
| Graphic provided by: Dynamic Trailing Stop RadarScreen by Fibozachi.com. |
| |
| Looking at the daily charts of both stocks reveals that AAPL's intermediate term money flow is weak, meaning that the break of DTS-3 should lead to a quick test of the DTS-5 trail at 92.43; in fact, this looks like a no-brainer short opportunity, one that might be best played with an in-the-money (ITM) long put option with at least 2 months of time value remaining. Set a stop near 96.50 and try to stay short until that next support is hit before selling and bailing out. For SMH, look to use a similar strategy to ride the ETF down to DTS-13 within the next week or two, using a modestly ITM long put as your trading vehicle. Most of the time, going for base hits is a safer and more profitable trading endeavor that trying to wait for the grand slam to come along... these two long put trades look like major league base hits for sure. Keep your account risk at 2% or less on either trade and remember to trade wisely until we meet here again. |
Freelance financial markets writer and online publisher of the Trendzetterz.com S&P 500 Weekly Forecast service.
| Title: | Market consultant and writer |
| Company: | Trendzetterz |
| Address: | 81 Hickory Hollow Drive |
| Crossville, TN 38555 | |
| Phone # for sales: | 904-303-4814 |
| Website: | trendzetterz.com |
| E-mail address: | support@trendzetterz.com |
Traders' Resource Links | |
| Trendzetterz has not added any product or service information to TRADERS' RESOURCE. | |
Click here for more information about our publications!
Comments

Request Information From Our Sponsors
- StockCharts.com, Inc.
- Candle Patterns
- Candlestick Charting Explained
- Intermarket Technical Analysis
- John Murphy on Chart Analysis
- John Murphy's Chart Pattern Recognition
- John Murphy's Market Message
- MurphyExplainsMarketAnalysis-Intermarket Analysis
- MurphyExplainsMarketAnalysis-Visual Analysis
- StockCharts.com
- Technical Analysis of the Financial Markets
- The Visual Investor
- VectorVest, Inc.
- Executive Premier Workshop
- One-Day Options Course
- OptionsPro
- Retirement Income Workshop
- Sure-Fire Trading Systems (VectorVest, Inc.)
- Trading as a Business Workshop
- VectorVest 7 EOD
- VectorVest 7 RealTime/IntraDay
- VectorVest AutoTester
- VectorVest Educational Services
- VectorVest OnLine
- VectorVest Options Analyzer
- VectorVest ProGraphics v6.0
- VectorVest ProTrader 7
- VectorVest RealTime Derby Tool
- VectorVest Simulator
- VectorVest Variator
- VectorVest Watchdog