HOT TOPICS LIST
- MACD
- Fibonacci
- RSI
- Gann
- ADXR
- Stochastics
- Volume
- Triangles
- Futures
- Cycles
- Volatility
- ZIGZAG
- MESA
- Retracement
- Aroon
INDICATORS LIST
LIST OF TOPICS
PRINT THIS ARTICLE
by Koos van der Merwe
Are the 50-period and 100-period moving averages indicators to be watched when it comes to market indices?
Position: Buy
Koos van der Merwe
Has been a technical analyst since 1969, and has worked as a futures and options trader with First Financial Futures in Johannesburg, South Africa.
PRINT THIS ARTICLE
MOVING AVERAGES
Watching the 50- and 100-Period Moving Averages
08/12/14 04:29:38 PMby Koos van der Merwe
Are the 50-period and 100-period moving averages indicators to be watched when it comes to market indices?
Position: Buy
| Since July 24th, the stock market has been in a correction, either because of concern about the Ukrainian crises and the downing of Flight MH17 killing all 283 passengers and 15 crew by the Ukranian separatists or because of the Israeli-Gaza conflict. Market indexes have fallen below the 50- and 100-period moving averages, and looking back at history, when this occurs, the various index's suggest a bottom. How accurate is this? |

|
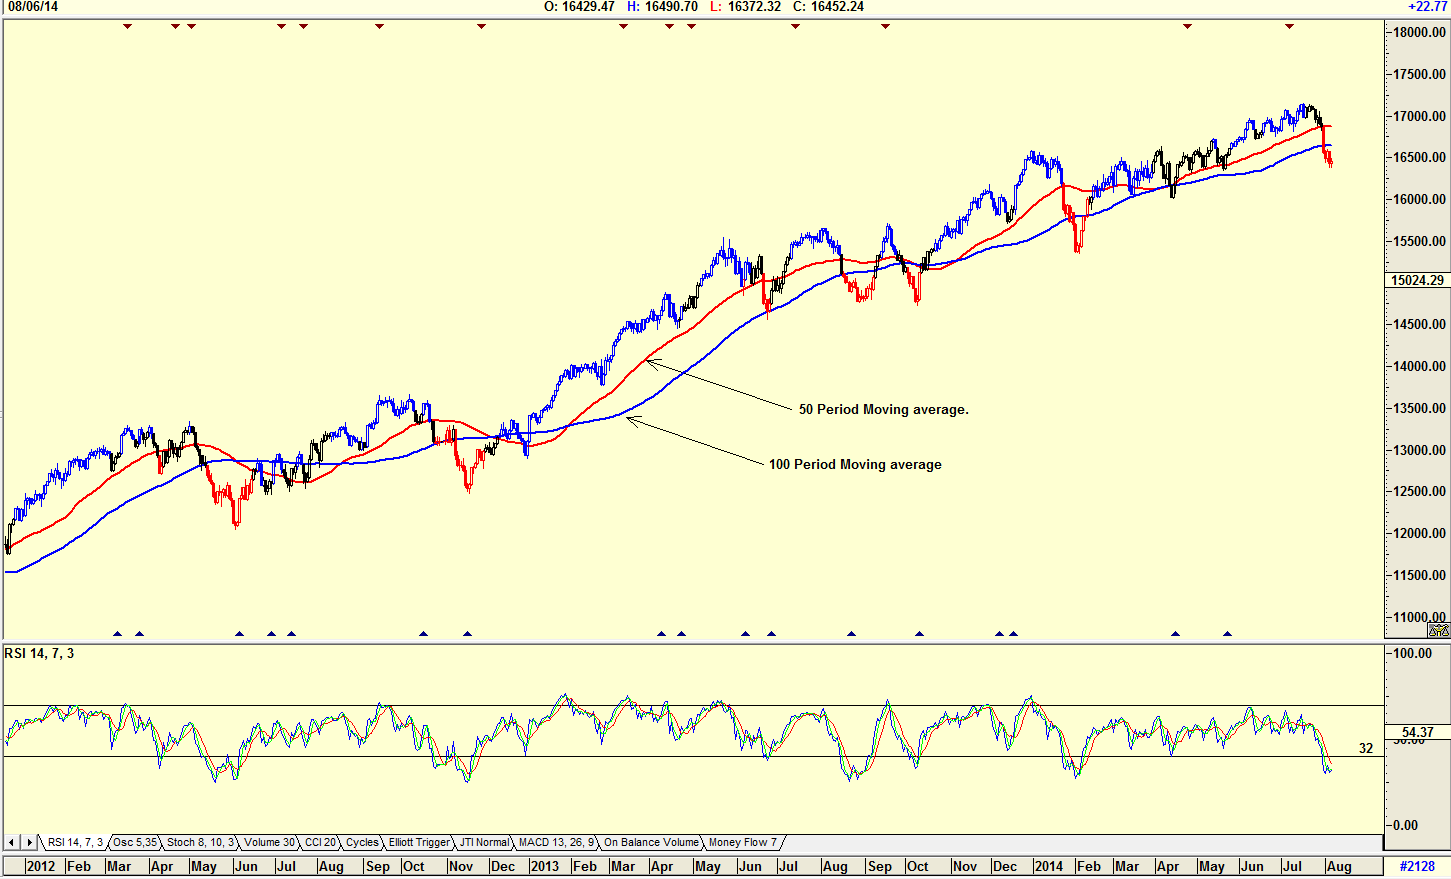
| Figure 1. Daily chart of the Dow Jones Industrial Average with 50- and 100-period moving averages suggesting a positive correction. |
| Graphic provided by: AdvancedGET. |
| |
| The chart in Figure 1 is a daily chart of the Dow Jones with the 50-period moving average and the 100-period moving average. One can see on the chart how every time the index has fallen below the 50-period moving average, the Dow has corrected upwards. However, the chart also shows that the corrections occur after the index has fallen below the 100-period moving average which gives one a better idea of when that correction is likely to occur. The chart is suggesting that the Dow is in a correction phase, and could start correcting upward anytime now. Do note the RSI indicator which is at oversold levels but has not given a buy signal. This will only occur when the indicator breaks above the 32 horizontal line. The moving average (red) on the RSI index also suggests a buy when the index breaks above it. |

|
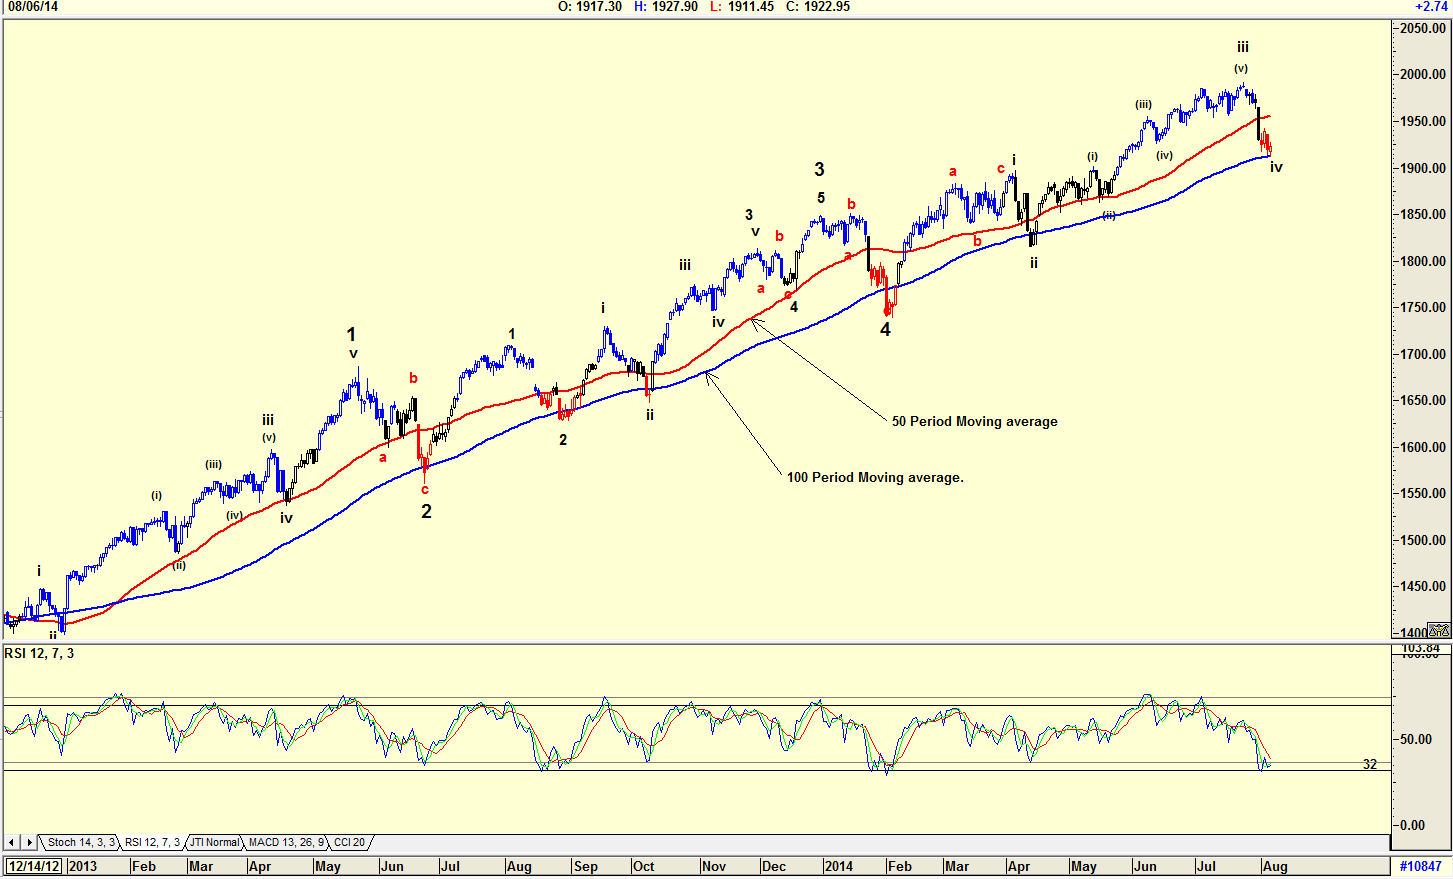
| Figure 2. Daily chart of the S&P500 index showing 50- and 100-day moving averages. |
| Graphic provided by: AdvancedGET. |
| |
| The chart in Figure 2 is that of the S&P 500 index with the 50-period and 100-period moving averages. Notice how the index always reverses upwards after it has broken below the 50-period moving average, and seems to find support on the 100-period moving average. At the moment the index is testing the 100-period moving average with an Elliott wave count suggesting that the index could start rising in a wave v of Wave 5. The RSI index is also oversold but has not yet given a buy. |

|
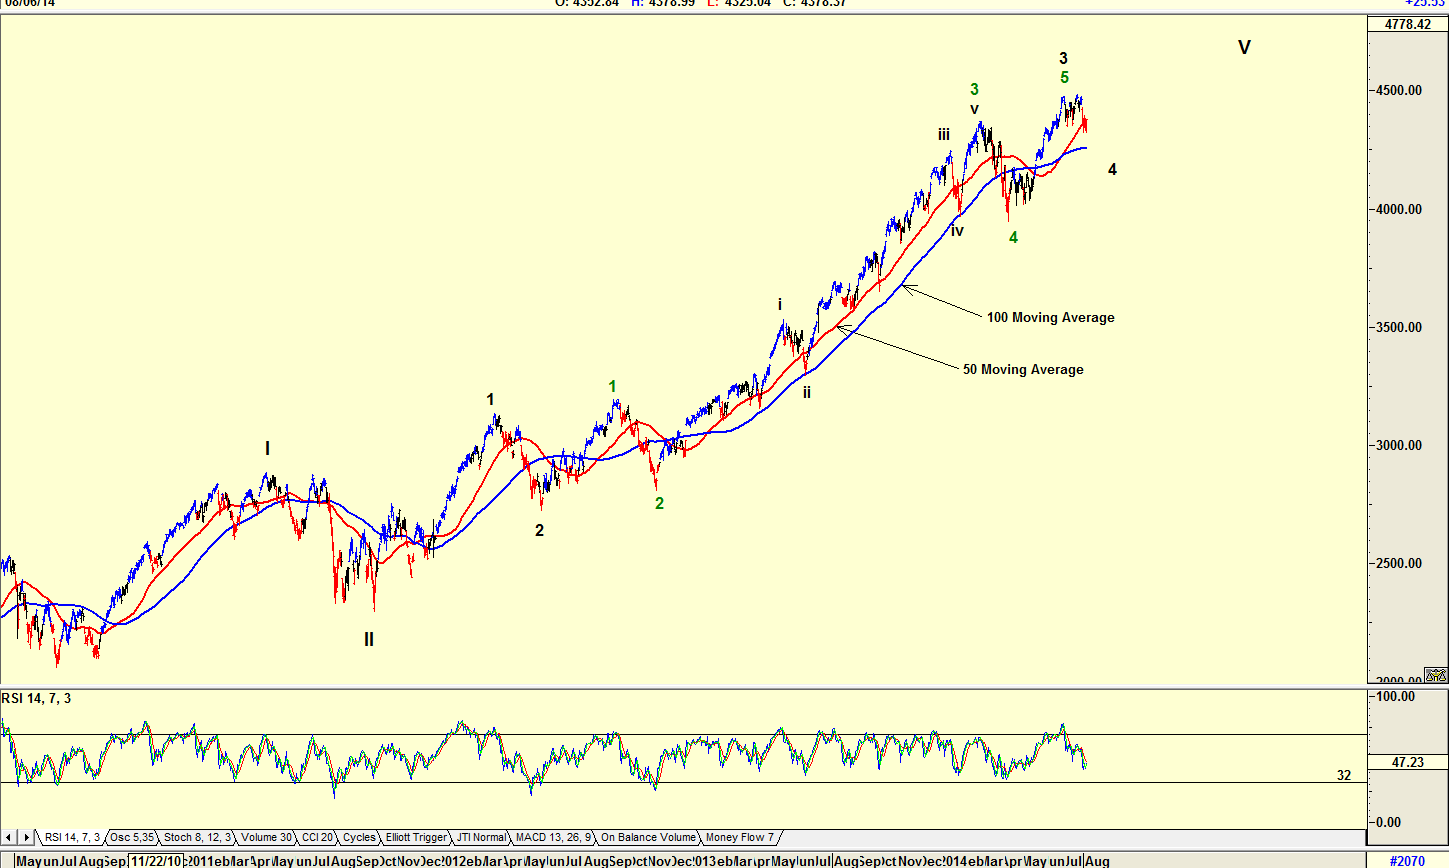
| Figure 3. Daily Nasdaq chart showing moving averages with only the 50-period moving average suggesting an upward correction. |
| Graphic provided by: AdvancedGET. |
| |
| With the Nasdaq Index in Figure 3, the chart shows that although the index has fallen below the 50-period moving average, it has not fallen below the 100-period moving average. However, looking back at history, one can see that a move below the 50-period moving average saw an upward correction with a move below the 100-period moving occurring only when a major Elliott wave downside correction occurred. The chart is suggesting that the index could fall further. The RSI indicator is confirming this as it is still falling, not having reached oversold levels. |

|
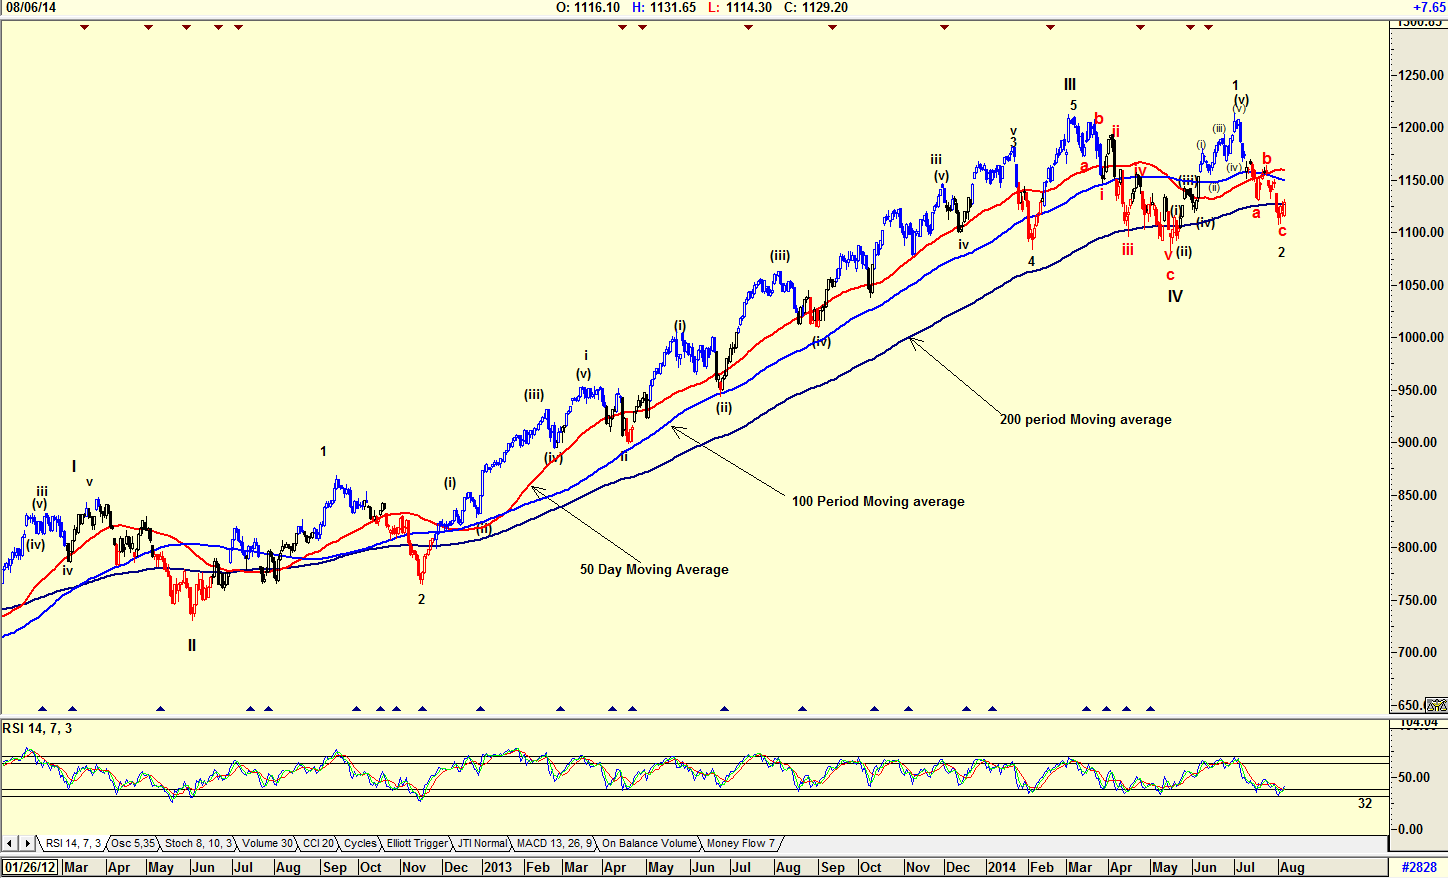
| Figure 4. Daily chart of the Russell 2000 index suggesting an upward correction based on the moving averages. |
| Graphic provided by: AdvancedGET. |
| |
| The chart in Figure 4 is a daily chart of the Russell 2000 index with the 50-day and 100-day moving averages. The index shows corrections upwards on minor reversals when it broke below the 50 period moving average and a correction after a major reversal when it broke below the 100 period moving average. An Elliott wave count will warn one whether to expect a major or minor reversal. However, with the Russell 2000 index, the 200-period moving average looks like the better indicator suggesting a correction is on the cards after a major reversal. Do note that the RSI indicator has given a buy signal. All the indicators shown above with the exception of the Nasdaq Index are suggesting buys. Does this mean that world tensions will start easing and that investors could start buying stocks? The answer is "yes" but time will tell whether the moving averages have been correct or not. Whatever the outcome, they are indicators that should be watched and followed. |
Has been a technical analyst since 1969, and has worked as a futures and options trader with First Financial Futures in Johannesburg, South Africa.
| Address: | 3256 West 24th Ave |
| Vancouver, BC | |
| Phone # for sales: | 6042634214 |
| E-mail address: | petroosp@gmail.com |
Click here for more information about our publications!
Comments

|

Request Information From Our Sponsors
- StockCharts.com, Inc.
- Candle Patterns
- Candlestick Charting Explained
- Intermarket Technical Analysis
- John Murphy on Chart Analysis
- John Murphy's Chart Pattern Recognition
- John Murphy's Market Message
- MurphyExplainsMarketAnalysis-Intermarket Analysis
- MurphyExplainsMarketAnalysis-Visual Analysis
- StockCharts.com
- Technical Analysis of the Financial Markets
- The Visual Investor
- VectorVest, Inc.
- Executive Premier Workshop
- One-Day Options Course
- OptionsPro
- Retirement Income Workshop
- Sure-Fire Trading Systems (VectorVest, Inc.)
- Trading as a Business Workshop
- VectorVest 7 EOD
- VectorVest 7 RealTime/IntraDay
- VectorVest AutoTester
- VectorVest Educational Services
- VectorVest OnLine
- VectorVest Options Analyzer
- VectorVest ProGraphics v6.0
- VectorVest ProTrader 7
- VectorVest RealTime Derby Tool
- VectorVest Simulator
- VectorVest Variator
- VectorVest Watchdog
