

HOT TOPICS LIST
- MACD
- Fibonacci
- RSI
- Gann
- ADXR
- Stochastics
- Volume
- Triangles
- Futures
- Cycles
- Volatility
- ZIGZAG
- MESA
- Retracement
- Aroon
INDICATORS LIST
LIST OF TOPICS
PRINT THIS ARTICLE
by Donald W. Pendergast, Jr.
When a well-defined, major consolidation fails to result in a continuation of the previous trend, look for a high probability move in the opposite direction.
Position: N/A
Donald W. Pendergast, Jr.
Freelance financial markets writer and online publisher of the Trendzetterz.com S&P 500 Weekly Forecast service.
PRINT THIS ARTICLE
CONSOLID FORMATION
ENDP: Prepping for a Breakdown?
08/07/14 04:01:41 PMby Donald W. Pendergast, Jr.
When a well-defined, major consolidation fails to result in a continuation of the previous trend, look for a high probability move in the opposite direction.
Position: N/A
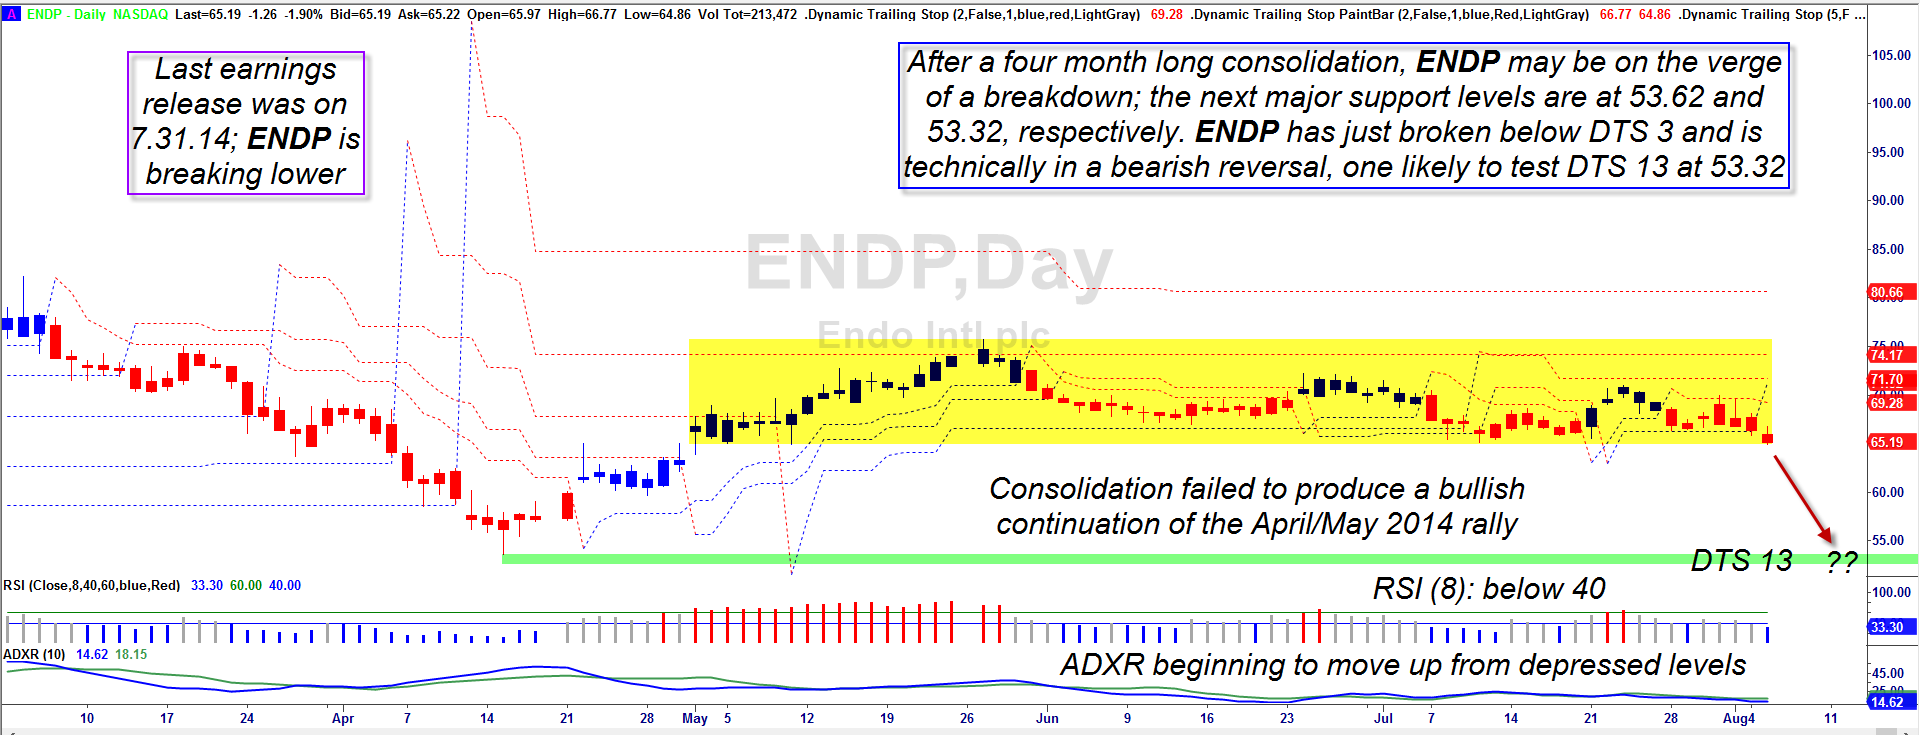
| Consolidation patterns can occur on any time frame chart and they come in a wide variety of shapes and sizes. A pattern that forms after a strong, sustained bullish trend thrust will often become the launching pad for what is known as a continuation move up and out of the pattern. Such bullish breakouts are great swing/trend following setups and can sometimes lead to strong gains. But what about beautiful consolidation patterns that simply do not lead to a continuation of the previous trend? Here's a look at one such pattern, using the daily chart of Endo International, PLC (ENDP), one that is ripe for further declines in the days/weeks ahead. |
|
| Figure 1. Endo International, PLC (ENDP): When a long term consolidation pattern fails to produce a continuation move higher, breaks below the pattern may offer a good short trading opportunity. |
| Graphic provided by: TradeStation. |
| Graphic provided by: Dynamic Trailing Stop by Fibozachi.com. |
| |
| Once ENDP made a major multicycle low on April 15, 2014 at 53.62 it turned higher after hitting the DTS 13 support level (Dynamic Trailing Stop) and rapidly began to clear trailing stop levels 2, 3, 5 and even made a brief leap above DTS 8, confirming the strength of the rally. The surge peaked out at 75.09 — good for a gain of 40% in just six weeks, with the DTS 2 and DTS 3 able to keep traders in the long position to capture the majority of the potential gain. After that strong spring rally, however, ENDP transitioned into what ultimately would become a multimonth range bound pattern — until August 5, 2014. That's when the stock was finally able to take out the pattern low of 65.11, dropping DTS 3 into a bearish trade, and is extra important because the stock is exiting the pattern on the same side it originally entered into it, and that is bad news for the bulls and a potentially profitable short sale confirmation for the bears. Coincident with the pattern breakdown, two key indicators have also confirmed the bearish shift in momentum: 1. The 10-day ADXR is turning higher from very depressed levels. 2. The 8-day RSI is well below 40.00; this is a reliable short signal, especially when confirmed by the ADX or ADXR and a key pattern break. Once ENDP is able to dip beneath Tuesday's low of 63.57, it will have exceeded all significant support levels (chart support and DTS support) opening up the prospect of a continued run south toward the next set of supports in the low 53.00 range. That's nearly 19% beneath Tuesday's close and it might be a good, moderate risk swing trade or long put play. |
|
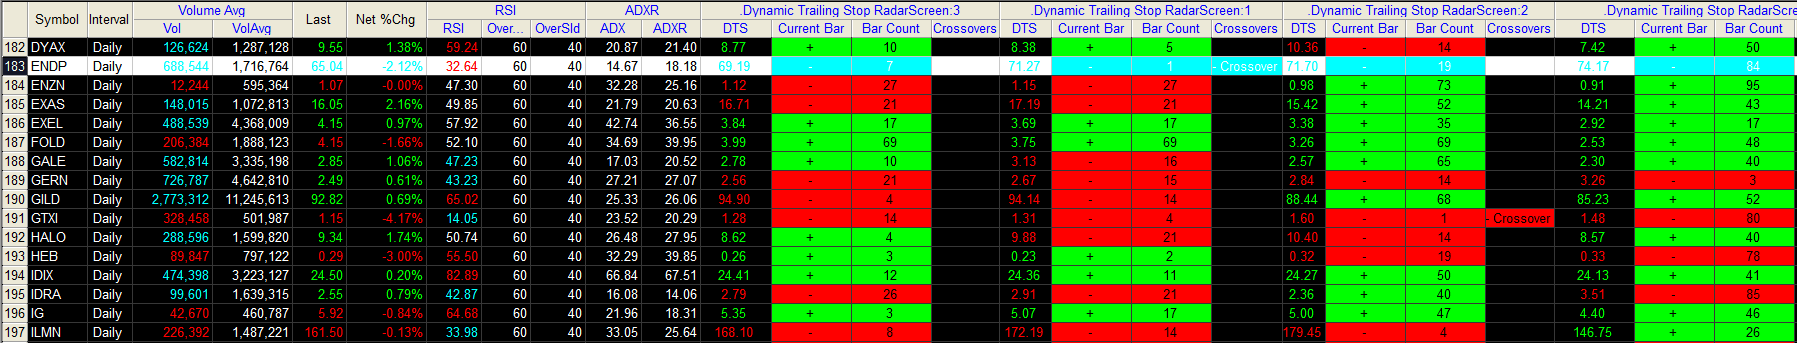
| Figure 2. With the drop below the DTS 8 trailing stop level on August 5, 2014, ENDP is now bearish at four consecutive Fibonacci degrees of trend. |
| Graphic provided by: TradeStation. |
| Graphic provided by: Dynamic Trailing Stop RadarScreen by Fibozachi.com. |
| |
| The January '14 ENDP $65.00 puts look reasonably attractive here for this short setup; the bid/ask is okay, daily time decay is low (less than $2/day per contract) and the delta is about -.4700. The big idea here is to capitalize on a high probability descent toward the DTS 13 stop at 53.32; if you see ENDP get anywhere near this level, start looking to trim back your position, taking half if not all of your gains before a short covering rally can erupt. Use the bottom of the yellow consolidation as your initial stop and then gradually reduce it as the stock declines. By no means let the stock close back inside the yellow shaded area and don't let the option lose more than half of its value before closing it out for a loss. Risk no more than 2% of your account value on this setup and be sure to trade wisely until we meet here again. |
Freelance financial markets writer and online publisher of the Trendzetterz.com S&P 500 Weekly Forecast service.
| Title: | Market consultant and writer |
| Company: | Trendzetterz |
| Address: | 81 Hickory Hollow Drive |
| Crossville, TN 38555 | |
| Phone # for sales: | 904-303-4814 |
| Website: | trendzetterz.com |
| E-mail address: | support@trendzetterz.com |
Traders' Resource Links | |
| Trendzetterz has not added any product or service information to TRADERS' RESOURCE. | |
Click here for more information about our publications!
PRINT THIS ARTICLE

Request Information From Our Sponsors
- StockCharts.com, Inc.
- Candle Patterns
- Candlestick Charting Explained
- Intermarket Technical Analysis
- John Murphy on Chart Analysis
- John Murphy's Chart Pattern Recognition
- John Murphy's Market Message
- MurphyExplainsMarketAnalysis-Intermarket Analysis
- MurphyExplainsMarketAnalysis-Visual Analysis
- StockCharts.com
- Technical Analysis of the Financial Markets
- The Visual Investor
- VectorVest, Inc.
- Executive Premier Workshop
- One-Day Options Course
- OptionsPro
- Retirement Income Workshop
- Sure-Fire Trading Systems (VectorVest, Inc.)
- Trading as a Business Workshop
- VectorVest 7 EOD
- VectorVest 7 RealTime/IntraDay
- VectorVest AutoTester
- VectorVest Educational Services
- VectorVest OnLine
- VectorVest Options Analyzer
- VectorVest ProGraphics v6.0
- VectorVest ProTrader 7
- VectorVest RealTime Derby Tool
- VectorVest Simulator
- VectorVest Variator
- VectorVest Watchdog