

HOT TOPICS LIST
- MACD
- Fibonacci
- RSI
- Gann
- ADXR
- Stochastics
- Volume
- Triangles
- Futures
- Cycles
- Volatility
- ZIGZAG
- MESA
- Retracement
- Aroon
INDICATORS LIST
LIST OF TOPICS
PRINT THIS ARTICLE
by Donald W. Pendergast, Jr.
Shares of Yelp, Inc. appear to be on target to move below the $60 level in the near future.
Position: N/A
Donald W. Pendergast, Jr.
Freelance financial markets writer and online publisher of the Trendzetterz.com S&P 500 Weekly Forecast service.
PRINT THIS ARTICLE
FIBONACCI
YELP: A Stock in Need of Help?
08/04/14 05:01:16 PMby Donald W. Pendergast, Jr.
Shares of Yelp, Inc. appear to be on target to move below the $60 level in the near future.
Position: N/A
| Last Thursday's big shakeout in the US equity markets sent many a big-name stock into a tizzy; shares of Yelp, Inc.(YELP) were among the worst hit, down by nearly 11% on the session. A variety of technical factors now suggest that the line of least resistance for this business/social networking issue is down toward the $60 price level &madash; and in a relatively short time period. Here's a closer look now. |
|
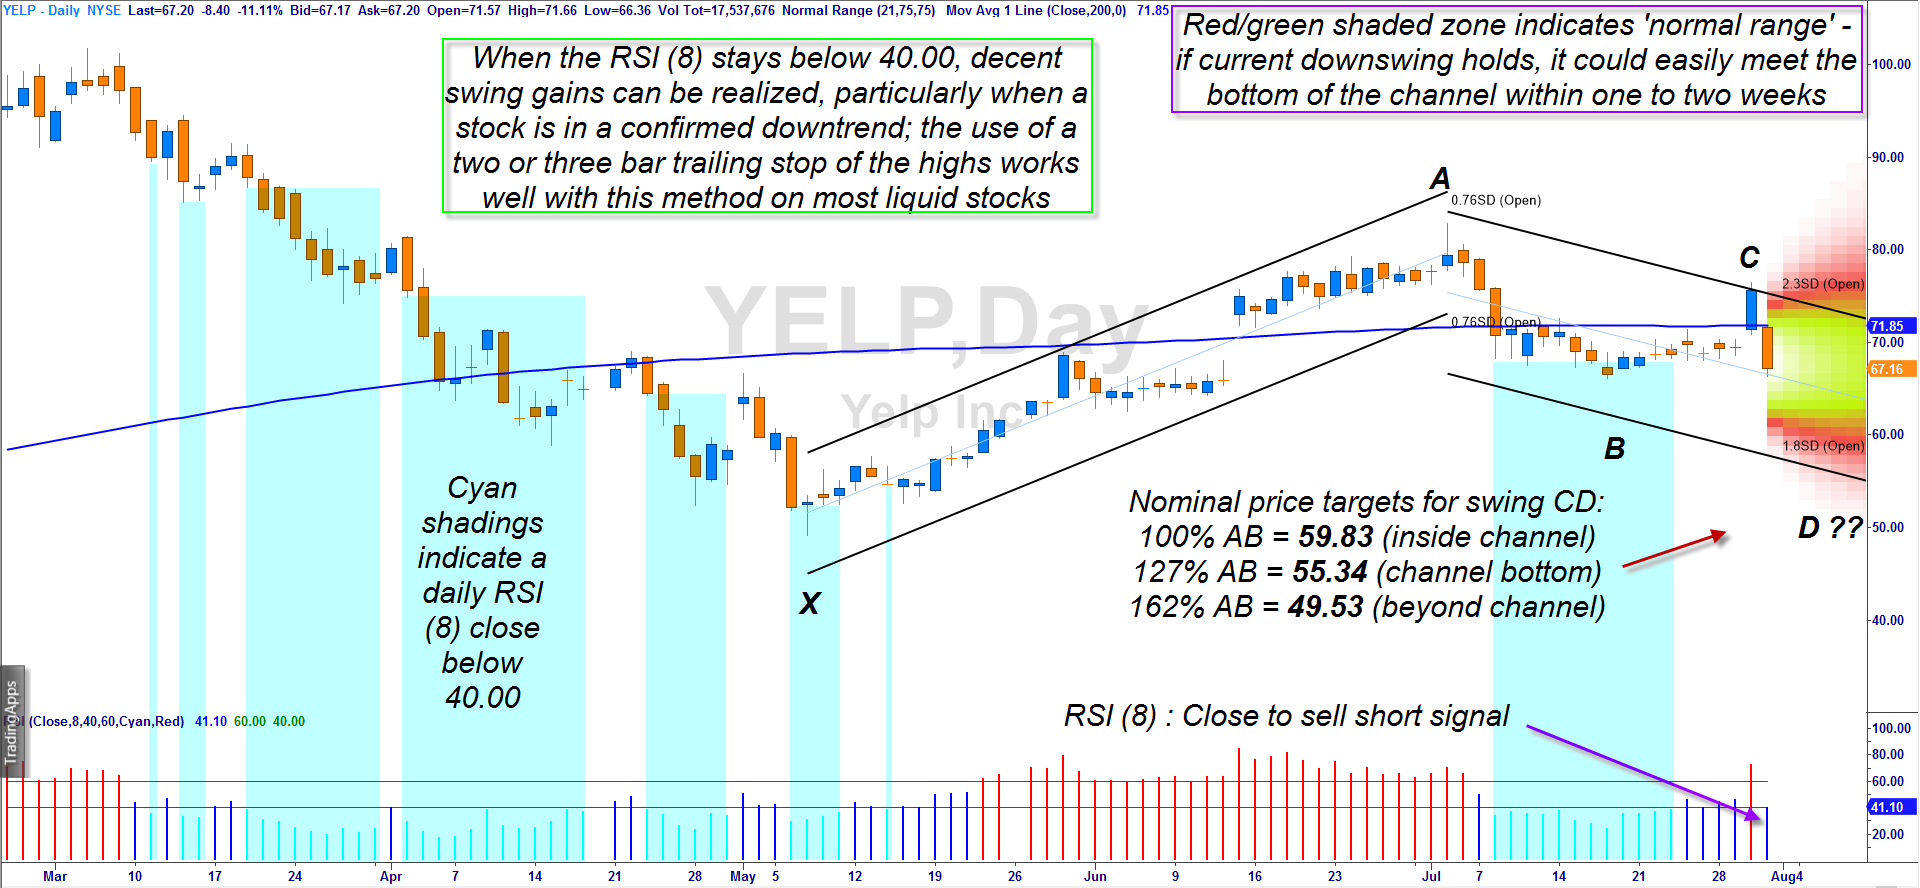
| Figure 1. Yelp, Inc. (YELP): A basic momentum oscillator entry trigger can be made much more effective if it is used in trending situations where logical Fibonacci-derived price targets can be determined beforehand. |
| Graphic provided by: TradeStation. |
| |
| YELP — at least on its daily and weekly time frame charts — can achieve some impressive trending moves that can make traders and investors some impressive gains; on intraday timeframes, however, the stock can make ragged, almost erratic leaps and plunges without meaningful follow through. The daily chart of YELP reveals a fairly trend worthy issue in terms of the big picture, but note how the stock tends to make sharp swings within the larger trending moves; one way to capitalize on this tendency is to use a simple breakout momentum oscillator that can help a trader capture the majority of each swing that may develop within the larger thrusts. For example, note all of the cyan shaded boxes on the chart; each one covers all of the price bars where the RSI(8) made a daily close below 40.00. Here are a few observations: 1. In about 2/3 of the examples, a tradable short swing move resulted after the RSI closed below 40.00. 2. When the RSI breakdown occurred in the midst of a larger down trending move, the bearish swings were more potent. 3. Waiting for the RSI to close back above 40.00 to trigger an exit was profitable sometimes, other times it was not. This would be an easy system to program into TradeStation or NinjaTrader (among other trading platforms) and a savvy developer should be able to make it work as a purely mechanical system on a variety of stocks, etf's and forex markets. There would be the need for visual market selection (does the stock make consistent, tradable swings, year-round, or not?) and lots and lots of back/forward testing and optimization work too. But what if you could just skip all of that jazz and trade the same short RSI(8) signals, knowing ahead of time where your most probable profit targets reside for the trade? Sure, it would take some extra visual scanning and calculations, but it might also help you find swing moves that are a cut above their 'take every trade' optimized brethren. Here's how to accomplish this, and we'll look at a very opportune short setup in YELP to provide understanding of the dynamics involved. |
|
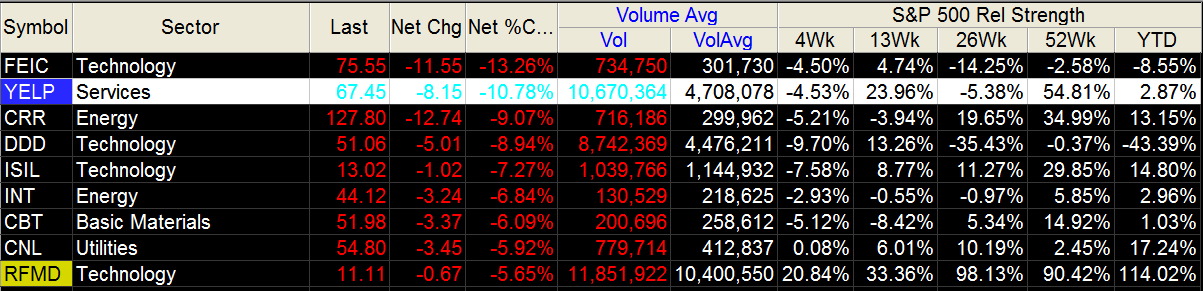
| Figure 2. YELP's 10.8% decline on the last trading day of July 2014 was a clear repudiation of its previous day's 8.9% rally. |
| Graphic provided by: TradeStation. |
| Graphic provided by: TradeStation RadarScreen. |
| |
| Swing point X marked a major multicycle low for YELP, after which it made a powerful trending thrust to point A, good for nearly 30 points. Then we see swing points B and then C appear and find that we can draw and extend out a linear regression channel starting at swing high A. Okay, so we have a basic bear channel drawn, and three significant swings calculated. Now what? Well, the first thing is to calculate the Fibonacci AB=CD price targets for swing CD: 1. 100% of swing AB = 59.83 (inside the channel) 2. 127% of swing AB = 55.34 (bottom of the channel) 3. 162% of swing AB = 49.53 (beyond the lower channel) Given the power of the July 31 bearish reversal in YELP, it's not hard to envision the stock descending to lower price levels within the channel; those Fibonacci-derived prices can be very useful when it comes time to take partial or even all of your profits — without waiting for an RSI rally back above 40.00 to provide your exit signal. Short covering rallies can steal lots of your hard-won open gains, so learning to take profits at likely swing target levels can help increase your profitability over time. Notice the 'Normal range' TradeStation 9.5 study applied to the right edge of the chart; this also provides a useful visual of statistically valid price projections heading into the future; note how the lower edge of the channel generally coincides with the lower zones of the orange range study — this also gives us a leading-edge clue as to where to expect the buyers to step back into the fray after YELP completes its next bearish thrust. |
| Armed with the above information, your short sale strategy for YELP looks like this: 1. Go short on a drop below Thursday's low of 66.36 2. Once filled, trail the position with a three-bar trail of the daily highs. 3. Once the first target (59.83) is hit, exit 40% of your position, keeping the same trailing stop on the balance. 4. If the second target (55.34 is hit, take another 40% off; start running a two-bar trail now. 5. If you are fortunate enough to still be short as 49.53 is hit, close out the trade and smile; really greedy traders might hold out for even more gains, but why take the risk of enduring a short squeeze? Keep your account risk at 2% or less, watch all open short trades for signs of a short squeeze and remember to trade wisely until we meet here again. |
Freelance financial markets writer and online publisher of the Trendzetterz.com S&P 500 Weekly Forecast service.
| Title: | Market consultant and writer |
| Company: | Trendzetterz |
| Address: | 81 Hickory Hollow Drive |
| Crossville, TN 38555 | |
| Phone # for sales: | 904-303-4814 |
| Website: | trendzetterz.com |
| E-mail address: | support@trendzetterz.com |
Traders' Resource Links | |
| Trendzetterz has not added any product or service information to TRADERS' RESOURCE. | |
Click here for more information about our publications!
PRINT THIS ARTICLE

Request Information From Our Sponsors
- VectorVest, Inc.
- Executive Premier Workshop
- One-Day Options Course
- OptionsPro
- Retirement Income Workshop
- Sure-Fire Trading Systems (VectorVest, Inc.)
- Trading as a Business Workshop
- VectorVest 7 EOD
- VectorVest 7 RealTime/IntraDay
- VectorVest AutoTester
- VectorVest Educational Services
- VectorVest OnLine
- VectorVest Options Analyzer
- VectorVest ProGraphics v6.0
- VectorVest ProTrader 7
- VectorVest RealTime Derby Tool
- VectorVest Simulator
- VectorVest Variator
- VectorVest Watchdog
- StockCharts.com, Inc.
- Candle Patterns
- Candlestick Charting Explained
- Intermarket Technical Analysis
- John Murphy on Chart Analysis
- John Murphy's Chart Pattern Recognition
- John Murphy's Market Message
- MurphyExplainsMarketAnalysis-Intermarket Analysis
- MurphyExplainsMarketAnalysis-Visual Analysis
- StockCharts.com
- Technical Analysis of the Financial Markets
- The Visual Investor