HOT TOPICS LIST
- MACD
- Fibonacci
- RSI
- Gann
- ADXR
- Stochastics
- Volume
- Triangles
- Futures
- Cycles
- Volatility
- ZIGZAG
- MESA
- Retracement
- Aroon
INDICATORS LIST
LIST OF TOPICS
PRINT THIS ARTICLE
by Koos van der Merwe
When a company makes a positive dividend announcement despite a recent share collapse, is the share worth looking at?
Position: Sell
Koos van der Merwe
Has been a technical analyst since 1969, and has worked as a futures and options trader with First Financial Futures in Johannesburg, South Africa.
PRINT THIS ARTICLE
TECHNICAL ANALYSIS
A Look At United States Steel Corp.
08/04/14 04:50:42 PMby Koos van der Merwe
When a company makes a positive dividend announcement despite a recent share collapse, is the share worth looking at?
Position: Sell
| United States Steel Corporation is a company that is headquartered in Pittsburgh, PA. The company part of the Fortune 200 and is a leading integrated steel producer. On July 29th the Board of Directors declared a dividend of five cents a share payable September 10th to stock holders of record at the close of business, August 13th, 2014. On July 29th the share price closed at $27.67. On July 30th the share price jumped on a gap to $33.03. |

|
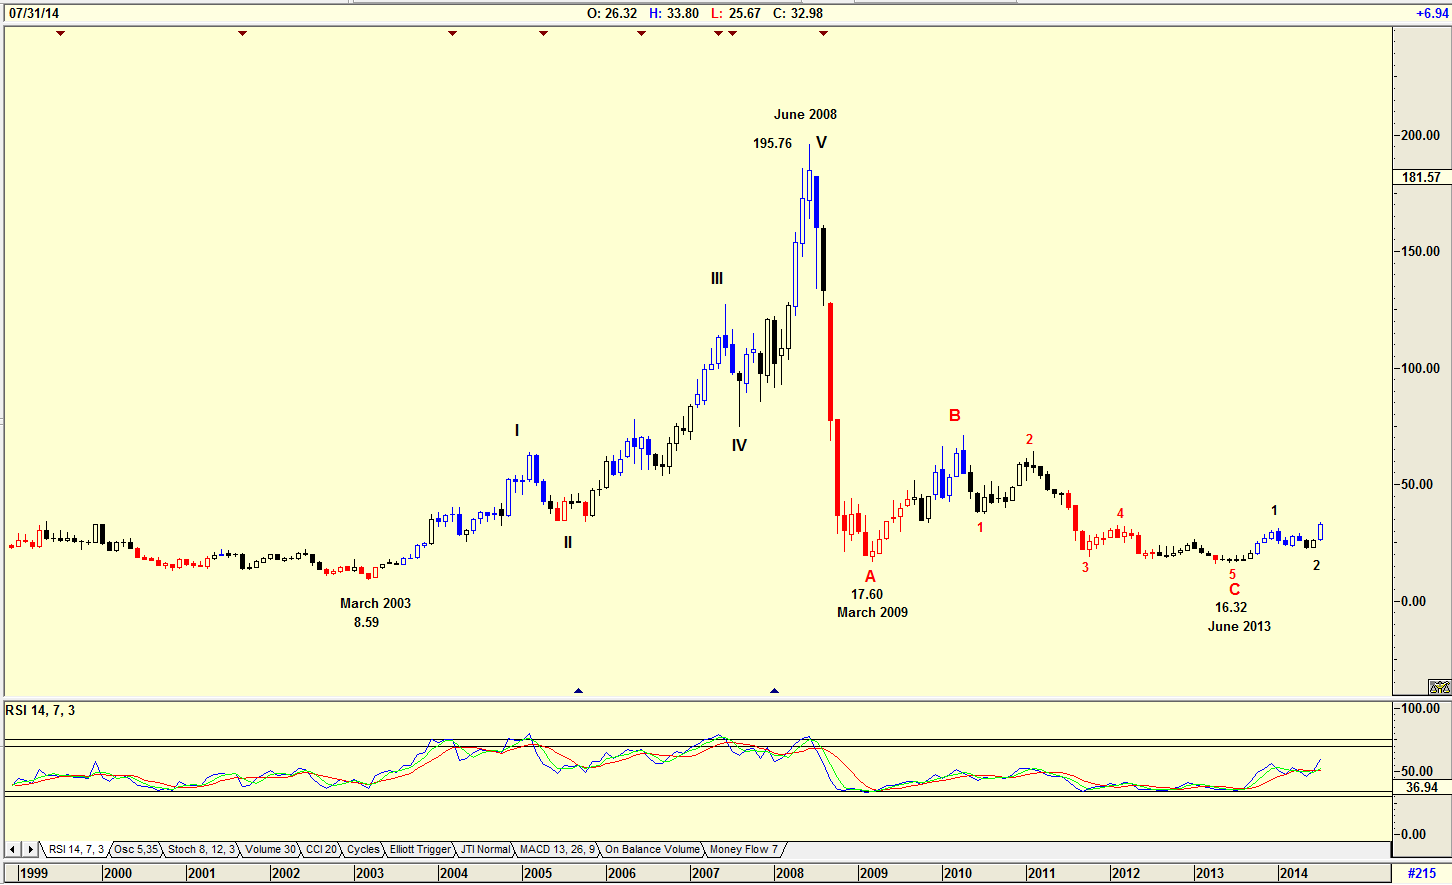
| Figure 1. Monthly chart with Elliott Wave count. |
| Graphic provided by: AdvancedGET. |
| |
| The chart in Figure 1 is a monthly chart showing how the price rose from $8.59 in March 2003 to $195.76 by June 2008 topping out in a WAVE V. The share price then corrected in an ABC correction to a low of $16.32 by June 2013. The share price started rising to its present price of $32.98 and appears to be in a wave 3 of a major WAVE 1. Time however will tell if this correct. The RSI indicator is rising, suggesting that the share could rise higher. |

|
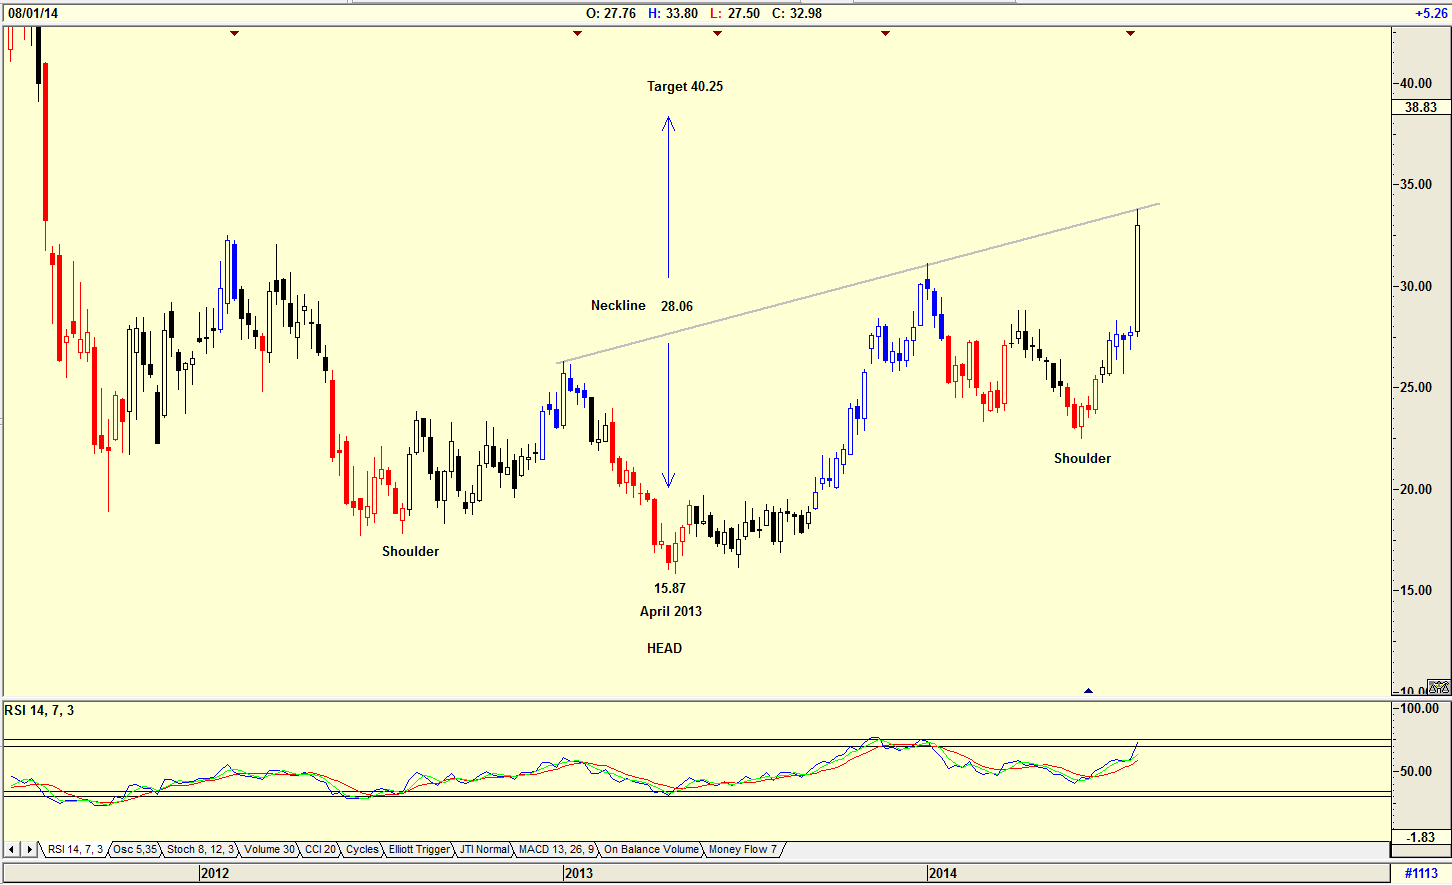
| Figure 2. Weekly Chart showing the inverse head and shoulders formation. |
| Graphic provided by: AdvancedGET. |
| |
| The chart in Figure 2 is a weekly chart showing an inverted head and shoulders formation that has developed. The target suggested should the price rise above the neckline is $40.25 (28.06-15.87=12.19+28.06=40.25). With the RSI still rising, the share price, which is testing the neckline, could break above it suggesting a buy. |

|
| Figure 3. Daily chart showing the gap that has formed. |
| Graphic provided by: AdvancedGET. |
| |
| The chart in Figure 3 is a daily chart showing the gap that formed. The Elliott Wave count is suggesting that the price will fall in an ABC correction to fill the gap somewhere between $28.44 and $31.12. The RSI indicator is at overbought levels suggesting that a correction is on the cards. |

|
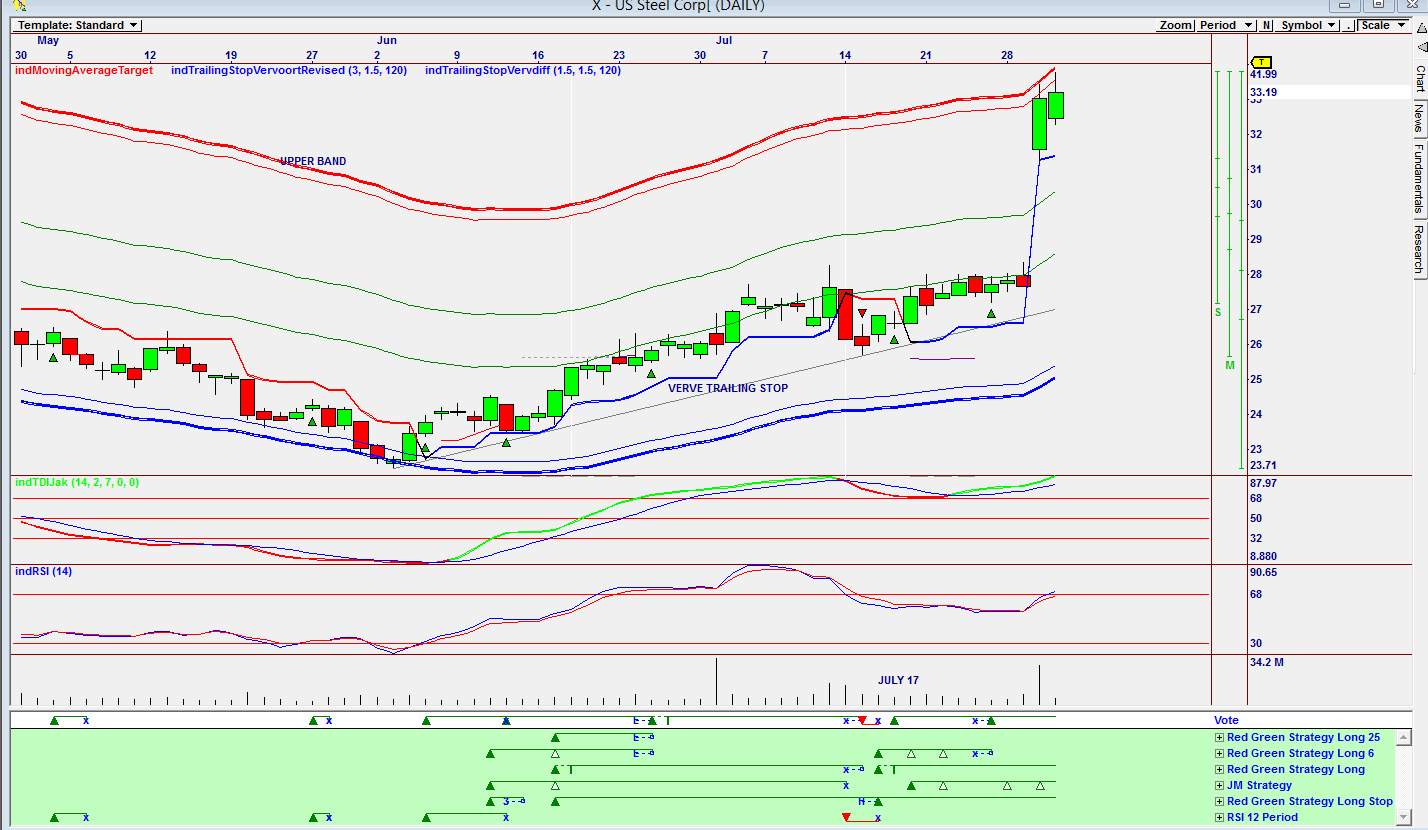
| Figure 4. Omnitrader chart showing Vote line buy signals. |
| Graphic provided by: Omnitrader. |
| |
| The chart is Figure 4 is an Omnitrader chart showing how the Vote line triggered a buy signal on July 17 based on the strategies in green below the Vote line. Both indicators shown on the chart are still positive. The fact that the price is testing the upper band does suggest that the share price could drop triggering a sell as it breaks below the Verve Trailing Stop. I would not be a buyer of United Steel Corp at the present price. I would prefer waiting for the share price to fall and fill the gap. When that happens I would look at my Elliott Wave count on a daily chart and look at the daily Omnitrader chart to see whether it is still in buy mode or whether a new buy has been triggered by the Vote line. |
Has been a technical analyst since 1969, and has worked as a futures and options trader with First Financial Futures in Johannesburg, South Africa.
| Address: | 3256 West 24th Ave |
| Vancouver, BC | |
| Phone # for sales: | 6042634214 |
| E-mail address: | petroosp@gmail.com |
Click here for more information about our publications!
PRINT THIS ARTICLE

Request Information From Our Sponsors
- VectorVest, Inc.
- Executive Premier Workshop
- One-Day Options Course
- OptionsPro
- Retirement Income Workshop
- Sure-Fire Trading Systems (VectorVest, Inc.)
- Trading as a Business Workshop
- VectorVest 7 EOD
- VectorVest 7 RealTime/IntraDay
- VectorVest AutoTester
- VectorVest Educational Services
- VectorVest OnLine
- VectorVest Options Analyzer
- VectorVest ProGraphics v6.0
- VectorVest ProTrader 7
- VectorVest RealTime Derby Tool
- VectorVest Simulator
- VectorVest Variator
- VectorVest Watchdog
- StockCharts.com, Inc.
- Candle Patterns
- Candlestick Charting Explained
- Intermarket Technical Analysis
- John Murphy on Chart Analysis
- John Murphy's Chart Pattern Recognition
- John Murphy's Market Message
- MurphyExplainsMarketAnalysis-Intermarket Analysis
- MurphyExplainsMarketAnalysis-Visual Analysis
- StockCharts.com
- Technical Analysis of the Financial Markets
- The Visual Investor
