

HOT TOPICS LIST
- MACD
- Fibonacci
- RSI
- Gann
- ADXR
- Stochastics
- Volume
- Triangles
- Futures
- Cycles
- Volatility
- ZIGZAG
- MESA
- Retracement
- Aroon
INDICATORS LIST
LIST OF TOPICS
PRINT THIS ARTICLE
by Chaitali Mohile
Is the corrective rally of SCL forming a bottom or will the shares continue moving downwards?
Position: Hold
Chaitali Mohile
Active trader in the Indian stock markets since 2003 and a full-time writer. Trading is largely based upon technical analysis.
PRINT THIS ARTICLE
FLAGS AND PENNANTS
Stepan Company On Bearish Track
08/01/14 02:48:10 PMby Chaitali Mohile
Is the corrective rally of SCL forming a bottom or will the shares continue moving downwards?
Position: Hold
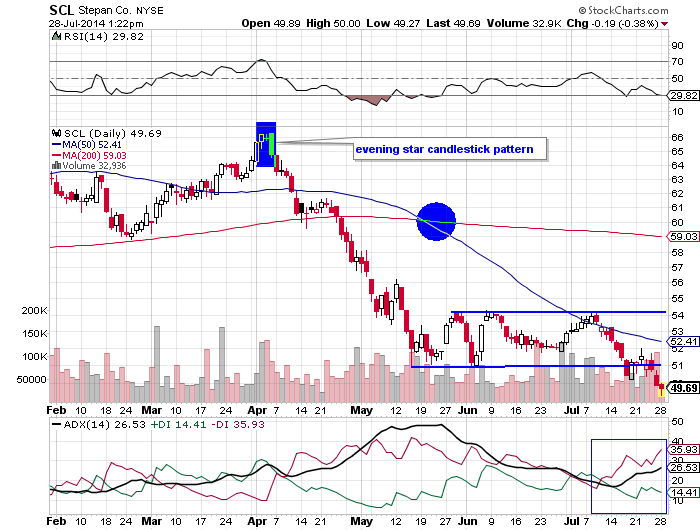
| Stepan Co. (SCL) has already plunged 20 points from the 66 levels. According to the Figure 1, SCL failed to develop a strong uptrend in February and March. Due to the weak bullish force, the stock formed an evening star candlestick at 66 levels. This candlestick pattern highlighted the first confirmed bearish reversal signal. The diminishing gap between the 50-day and the 200-day moving averages (MA) was another bearish technical indication on the daily time frame in Figure 1. Eventually, the evening star candlestick pattern initiated a downside price rally. The price movement witnessed huge bearish pressure; as a result, SCL speedily plunged below the moving average support. |
|
| Figure 1: Daily chart of SCL. |
| Graphic provided by: StockCharts.com. |
| |
| A developing downtrend indicated by the average directional index (ADX)(14) turned stronger as the bearish moving average crossover appeared on the price chart in Figure 1. Gradually, the stock began losing its higher levels. All those red candles in Figure 1 show the bearish hold on the downside rally. An oversold relative strength index (RSI)(14) and the highly overheated downtrend indicated trend reversal possibilities. The declining rally reversed by changing its downwards direction to sideways. SCL entered a bearish consolidation between the wide range of 51 and 54. The consolidation that follows the bearish rally forms a bearish flag & pennant formation — a bearish continuation pattern. However, you need to first clarify whether SCL is consolidating or forming a bottom at lower levels. |
| Currently, the stock has marginally breached the lower consolidation level. The ADX(14) is suggesting developing downtrend and the RSI(14), though oversold, has enough space to move in its bearish region (30 levels). Therefore, the daily chart is suggesting that SCL is forming the bearish flag & pennant formation. |
|
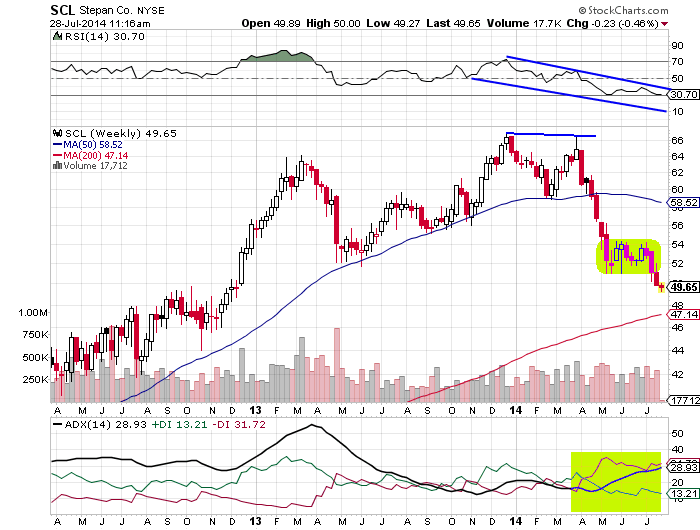
| Figure 2. Weekly chart of SCL. |
| Graphic provided by: StockCharts.com. |
| |
| On the weekly time frame chart in Figure 2, SCL formed a double top — bearish reversal formation at the top (66 levels). The lower highs formed by the RSI(14) showed a negative divergence, and the ADX(14) indicated weak trend formation. The tangled positive directional index (+DI) and negative directional index (-DI) of the ADX(14) highlighted the jittery trend. Later, the price rally breached the 50-day MA support, inducing high bearish force in the stock. The yellow box on the price chart in Figure 2 shows bearish consolidation of SCL. The ADX(14) and the RSI(14) both are showing bearish signals, therefore, the bearish flag & pennant continuation pattern is confirmed. However, the stock has immediate support of 200-day MA at 47 levels. Therefore, you need wait and watch the price action near this long-term moving average support before deciding the trading position. If the stock sustains above the MA support, it is likely to reverse by forming a bottom. |
| Hence, you need to the track the bearish price movement of SCL near the 200-day MA support. Currently, the traders with short- positions can hold their trade till SCL hits the support. If the stock violates the 200-day MA support, then the stock is likely to see the target of $39 calculated by subtracting length of flag pole from the breakout point (52-13=39). |
Active trader in the Indian stock markets since 2003 and a full-time writer. Trading is largely based upon technical analysis.
| Company: | Independent |
| Address: | C1/3 Parth Indraprasth Towers. Vastrapur |
| Ahmedabad, Guj 380015 | |
| E-mail address: | chaitalimohile@yahoo.co.in |
Traders' Resource Links | |
| Independent has not added any product or service information to TRADERS' RESOURCE. | |
Click here for more information about our publications!
PRINT THIS ARTICLE

Request Information From Our Sponsors
- VectorVest, Inc.
- Executive Premier Workshop
- One-Day Options Course
- OptionsPro
- Retirement Income Workshop
- Sure-Fire Trading Systems (VectorVest, Inc.)
- Trading as a Business Workshop
- VectorVest 7 EOD
- VectorVest 7 RealTime/IntraDay
- VectorVest AutoTester
- VectorVest Educational Services
- VectorVest OnLine
- VectorVest Options Analyzer
- VectorVest ProGraphics v6.0
- VectorVest ProTrader 7
- VectorVest RealTime Derby Tool
- VectorVest Simulator
- VectorVest Variator
- VectorVest Watchdog
- StockCharts.com, Inc.
- Candle Patterns
- Candlestick Charting Explained
- Intermarket Technical Analysis
- John Murphy on Chart Analysis
- John Murphy's Chart Pattern Recognition
- John Murphy's Market Message
- MurphyExplainsMarketAnalysis-Intermarket Analysis
- MurphyExplainsMarketAnalysis-Visual Analysis
- StockCharts.com
- Technical Analysis of the Financial Markets
- The Visual Investor