

HOT TOPICS LIST
- MACD
- Fibonacci
- RSI
- Gann
- ADXR
- Stochastics
- Volume
- Triangles
- Futures
- Cycles
- Volatility
- ZIGZAG
- MESA
- Retracement
- Aroon
INDICATORS LIST
LIST OF TOPICS
PRINT THIS ARTICLE
by Billy Williams
The US markets have been taking some hits lately but Chinese stocks are surging and one stock is setting up to explode higher.
Position: Buy
Billy Williams
Billy Williams has been trading the markets for 27 years, specializing in momentum trading with stocks and options.
PRINT THIS ARTICLE
HEAD & SHOULDERS
The Micro And Macro Of QIHU
07/31/14 02:57:32 PMby Billy Williams
The US markets have been taking some hits lately but Chinese stocks are surging and one stock is setting up to explode higher.
Position: Buy
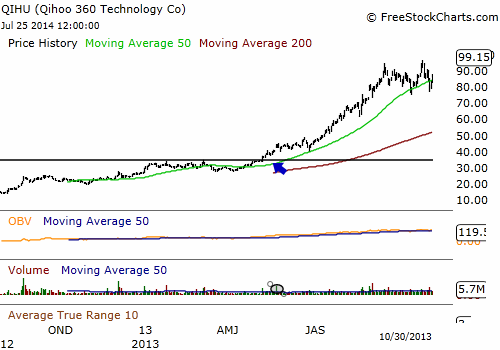
| The US market has been presented with disappointing earnings news lately, but despite the gray clouds there exists a silver lining: Chinese stocks. Overall, pockets of strength can be found in the market in Chinese companies that are growing from serving an ever-expanding market with online security software — and search engine provider Qihoo 360 Technology (QIHU) is leading the way. QIHU develops and markets software to protect its users (mobile and desktop) from malicious software. In the past, the stock has experienced a strong trend but has run into trouble lately. However, there are signs that the bulls could get control of the stock's price movement again. In May 6, 2013, QIHU traded up through the $35 resistance point from out of a base pattern. Volume at the time of the breakout was almost 300% of its 50-day average which fueled QIHU's rise where the stock went on to gain almost 60 points before entering a correction. |
|
| Figure 1. On May 6, 2013, QIHU broke higher after establishing a first stage base pattern. The stock surged and went on to gain almost 60 points in just 4 months. |
| Graphic provided by: www.freestockcharts.com. |
| |
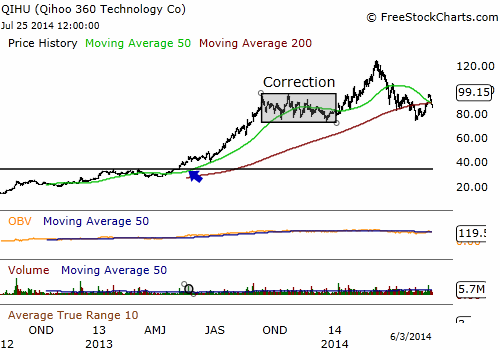
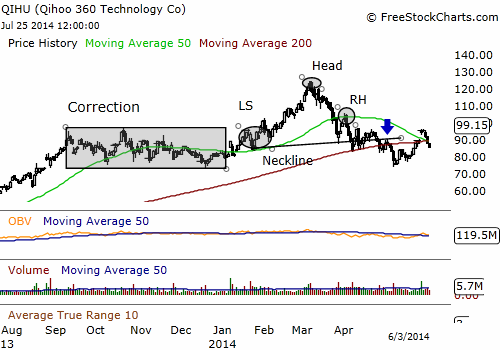
| After peaking at close to $95, QIHU entered a period of price contraction and established a trading range. Support held at the $75 price point and resistance remained firm at the $95 level. From September of 2013 to January of 2014 — a period of almost 6 months — price meandered back and forth without committing to either direction. Despite the lackluster price movement, the stock resisted periods of distribution that took place during this 6-month period and never wavered below the $75 support level. This maintaining of trading close to its all-time high spoke well of the stock's strength and indicated that the bulls were hopeful of getting control of the trend at some point in the future. QIHU went on to trade higher at the beginning of 2014 and it looked as if the bull's patience would be rewarded but the stock traded lower after peaking at just over $124 a share on March 7, 14. QIHU went on to make a series of lower highs and lower lows in its price action but then managed a weak rally before trading lower. This sequence of price action formed a head & shoulders pattern that indicated that the stock was ready to be taken down by the bears. This was confirmed on April 7, 2014 as the neckline of the pattern was broken and signaled that the trend was going to reverse course. |
|
| Figure 2. After a strong run-up in price, QIHU entered a correction but still held firm near it's all-time price high, a strong bullish indicator. |
| Graphic provided by: www.freestockcharts.com. |
| |
| But the bulls fought back and the stock's future direction is now in doubt. After the bearish signal was confirmed from the price pattern the stock traded below its 50-day and 200-day SMA, a bearish indicator in itself, but then the stock managed to trade higher and close over the two key technical indicators. Now, QIHU looks as if its forming a "ledge" to the right of its price action where price could "fall over" if distribution occurred on a large enough level. Adding to that, the price action within that ledge has formed a series of higher highs and higher lows, indicating the trend within the larger trend has reversed again but, considering the context of the stock's price action, that isn't enough to declare the bulls have control of the stock yet. |
|
| Figure 3. QIHU floundered a bit as it tried to trade above resistance but then fell apart. Later, its price action formed a head & shoulders pattern, a bearish price reversal indicator, but the bulls managed to hang on and put up a fight and possibly gain back control of the trend. |
| Graphic provided by: www.freestockcharts.com. |
| |
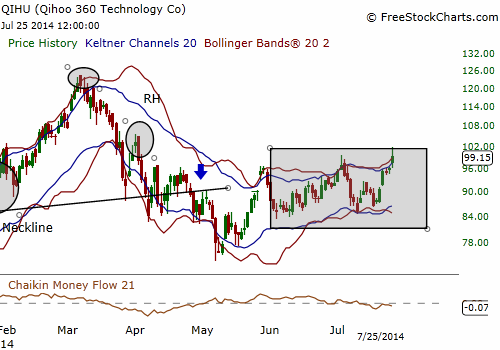
| Now, price has to close definitively over the previous price highs which it hasn't done yet. QIHU has to trade and close above $99.57 and go on to make a higher low as well before the bulls can be declared the victor. There is a strong likelihood of this happening as the stock entered a "squeeze" setup in recent weeks where its Bollinger Bands contracted within its Keltner Channels revealing the potential of explosive price action in the near term. If it does, then volatility occurring at the micro-level could serve as the launch pad for QIHU to trade higher. But it's also worth pointing out that at the macro-level, QIHU is forming a base pattern that could also serve as staging ground for the trend to resume its upward price movement. |
|
| Figure 4. Recently, QIHU has entered a "squeeze" setup which could lead to explosive price action. If the bulls regain control, then the stock's upward movement could resume. |
| Graphic provided by: www.freestockcharts.com. |
| |
| If you're aggressive, then look to enter as QIHU closes above the $99.57 level, forms another higher low and then enter as it trades above the new price high. Or, if you're more conservative, wait for the stock to trade up through its previous all-time high of $124.42 and go long with a 7% stop loss from your entry point. |
Billy Williams has been trading the markets for 27 years, specializing in momentum trading with stocks and options.
| Company: | StockOptionSystem.com |
| E-mail address: | stockoptionsystem.com@gmail.com |
Traders' Resource Links | |
| StockOptionSystem.com has not added any product or service information to TRADERS' RESOURCE. | |
Click here for more information about our publications!
Comments

Request Information From Our Sponsors
- StockCharts.com, Inc.
- Candle Patterns
- Candlestick Charting Explained
- Intermarket Technical Analysis
- John Murphy on Chart Analysis
- John Murphy's Chart Pattern Recognition
- John Murphy's Market Message
- MurphyExplainsMarketAnalysis-Intermarket Analysis
- MurphyExplainsMarketAnalysis-Visual Analysis
- StockCharts.com
- Technical Analysis of the Financial Markets
- The Visual Investor
- VectorVest, Inc.
- Executive Premier Workshop
- One-Day Options Course
- OptionsPro
- Retirement Income Workshop
- Sure-Fire Trading Systems (VectorVest, Inc.)
- Trading as a Business Workshop
- VectorVest 7 EOD
- VectorVest 7 RealTime/IntraDay
- VectorVest AutoTester
- VectorVest Educational Services
- VectorVest OnLine
- VectorVest Options Analyzer
- VectorVest ProGraphics v6.0
- VectorVest ProTrader 7
- VectorVest RealTime Derby Tool
- VectorVest Simulator
- VectorVest Variator
- VectorVest Watchdog