HOT TOPICS LIST
- MACD
- Fibonacci
- RSI
- Gann
- ADXR
- Stochastics
- Volume
- Triangles
- Futures
- Cycles
- Volatility
- ZIGZAG
- MESA
- Retracement
- Aroon
INDICATORS LIST
LIST OF TOPICS
PRINT THIS ARTICLE
by Koos van der Merwe
HomeAway, Inc. (AWAY) is a share to add to your watch list.
Position: Buy
Koos van der Merwe
Has been a technical analyst since 1969, and has worked as a futures and options trader with First Financial Futures in Johannesburg, South Africa.
PRINT THIS ARTICLE
ELLIOTT WAVE
HomeAway, Inc.
07/31/14 02:42:55 PMby Koos van der Merwe
HomeAway, Inc. (AWAY) is a share to add to your watch list.
Position: Buy
| "We've had another great quarter, once again delivering results above our expectations," says Brian Sharples, chief executive officer of HomeAway, Inc. (AWAY). HomeAway, Inc. is based in Austin, Texas. It is the world's leading online marketplace for the vacation rental industry. They have sites representing over one million paid listings of vacation rental homes in 190 countries. |

|
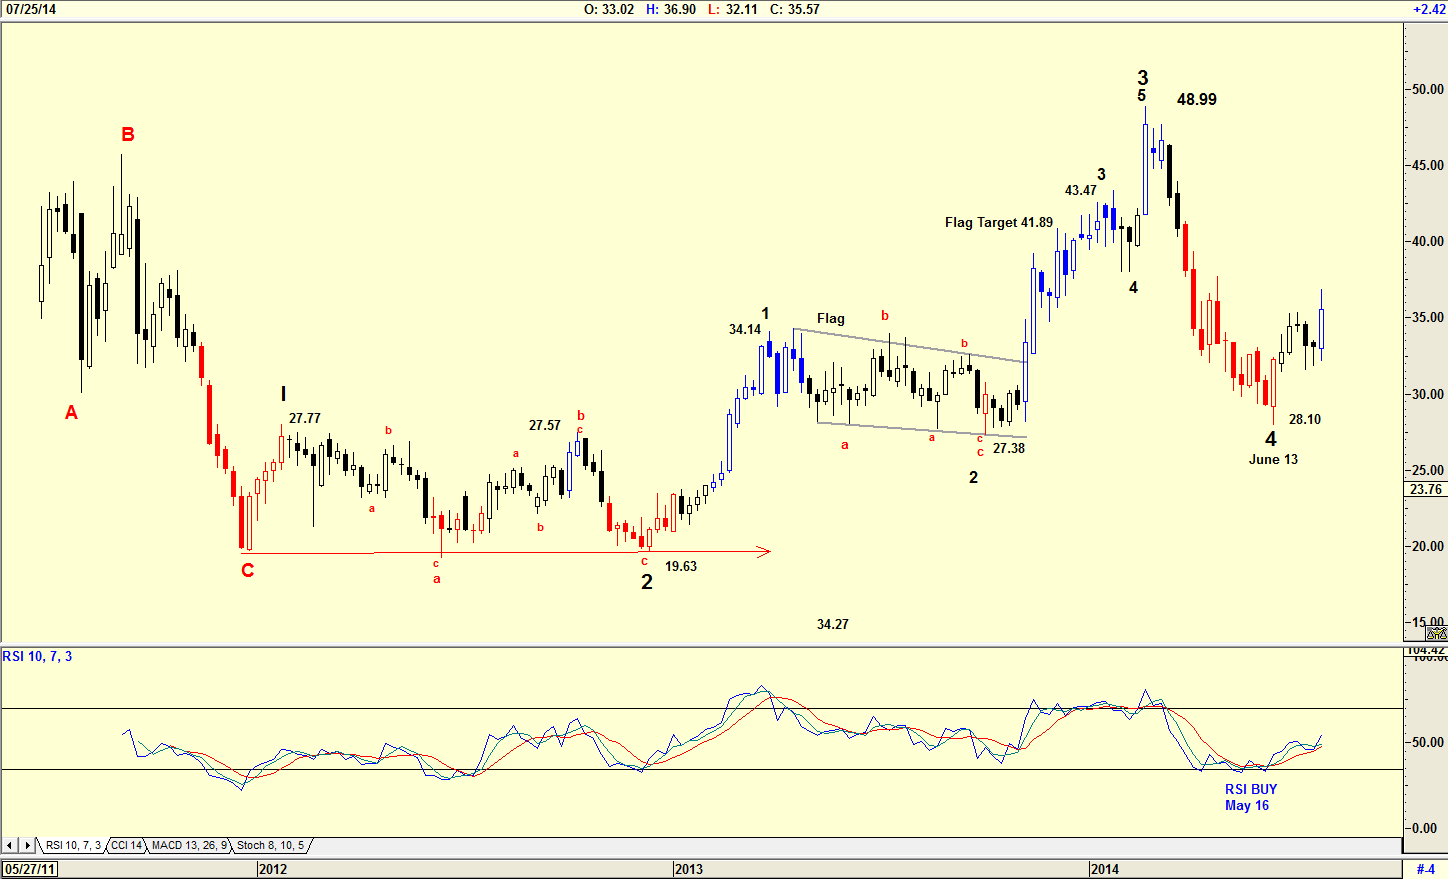
| Figure 1. Weekly chart of AWAY with an Elliott Wave count. |
| Graphic provided by: AdvancedGET. |
| |
| The chart in Figure 1 is a weekly chart, with an Elliott Wave count suggesting that the share could be moving into an Elliott Wave 5 that will see it rise above $48.99, the high of WAVE 3. The RSI indicator which gave a buy signal on May 16th is confirming this. With WAVE 2 falling to the same level as WAVE C, a double bottom formed. A wave 2 can correct 100% and even more to a wave 1. Do note that wave 2 of WAVE 2 formed a flag pattern. The target determined by the pattern is $41.89, close to the wave 3 of WAVE 3 top. What is disturbing, suggesting that the Elliott Wave count could be incorrect, is that WAVE 4 has fallen below the 4th wave of lesser degree at $28.10. However at $28.10 it never fell below $27.77, the upper level of WAVE 1. Nevertheless, it does mean that the wave count could change as the share moves forward. |

|
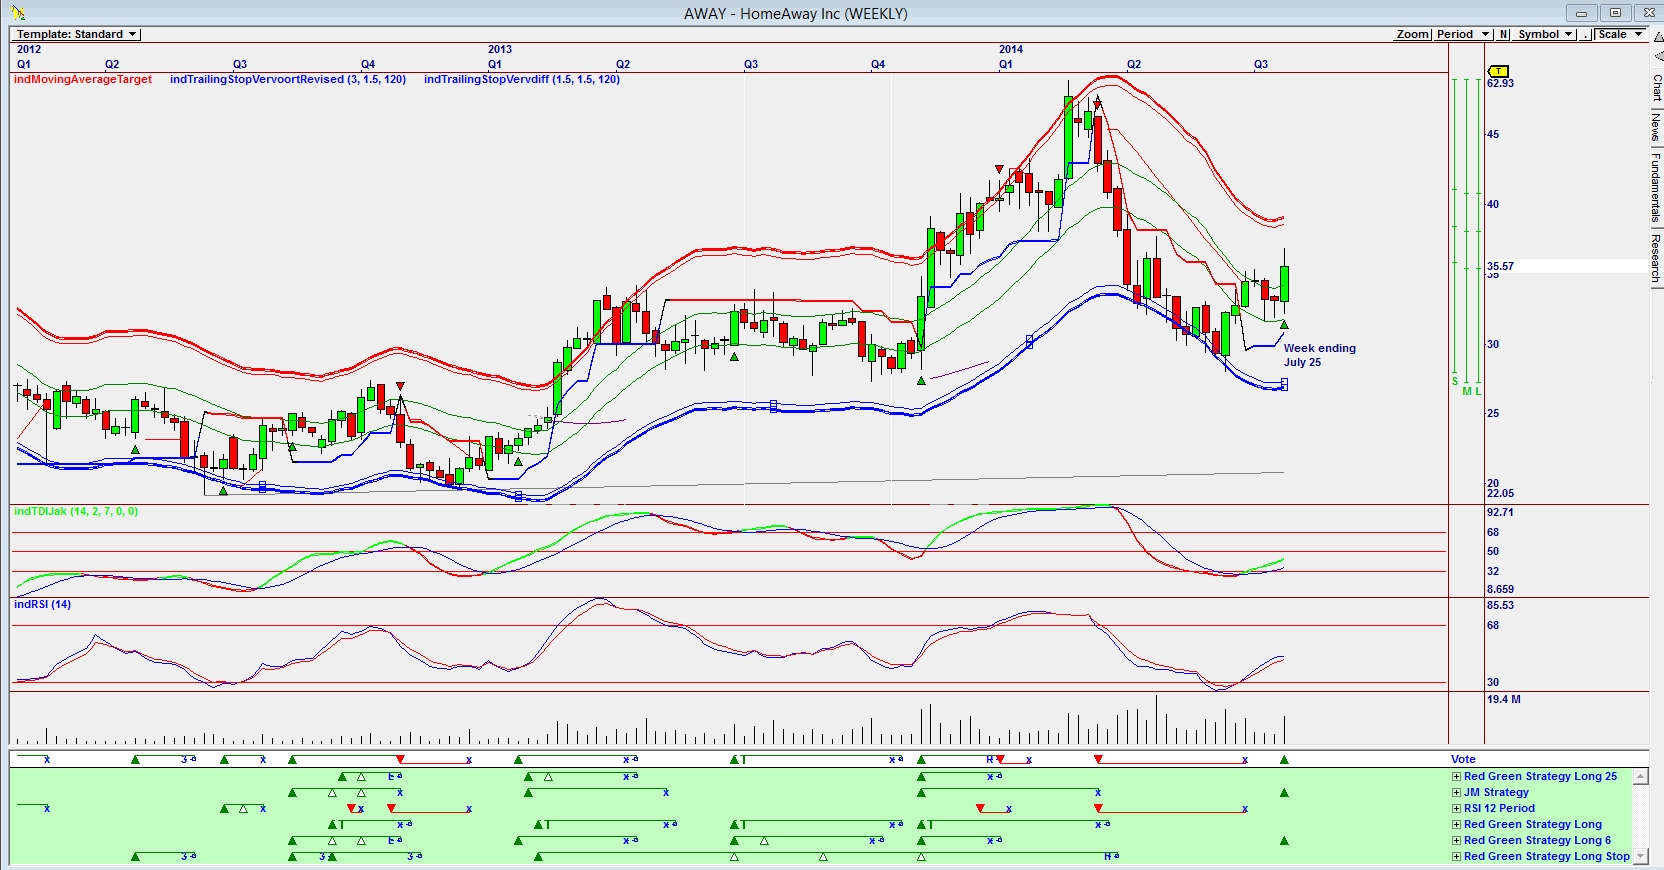
| Figure 2. Weekly Omnitrader chart showing a buy signal. |
| Graphic provided by: Omnitrader. |
| |
| The chart in Figure 2 is a weekly Omnitrader chart that brought the share to my attention. A buy signal was triggered on the Vote line on the week ending July 25 by the JM Strategy and the RedGreen Long 6 strategy. Both the RSI indicator and the TDIJak indicator are positive, suggesting that the buy signal given could be credible. |

|
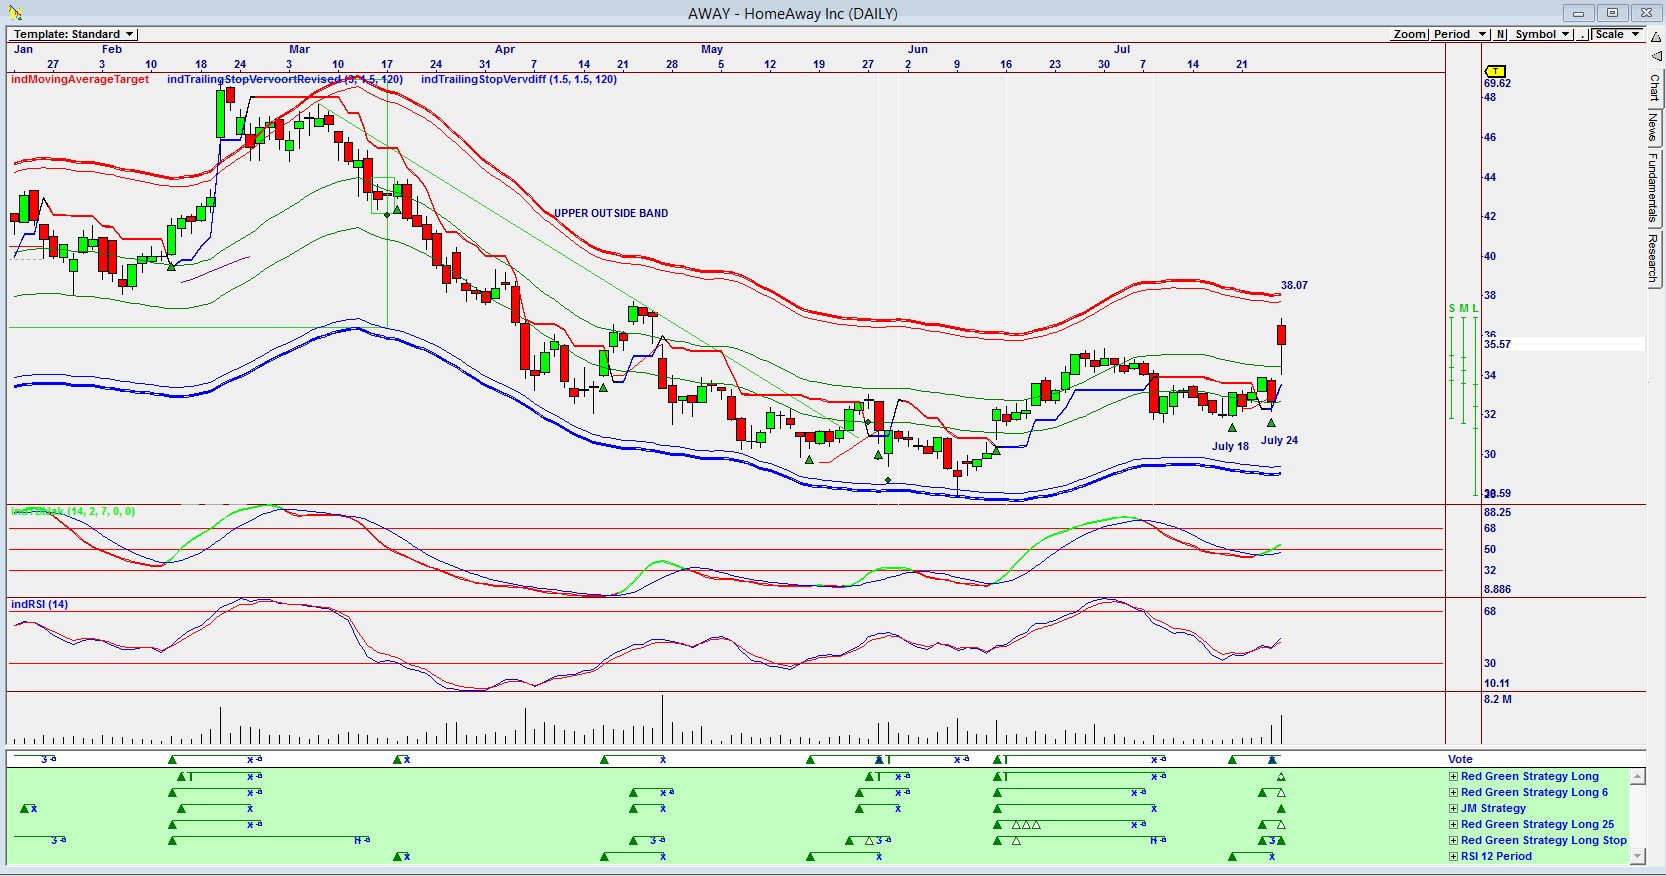
| Figure 3. Daily Omnitrader chart showing a buy signal. |
| Graphic provided by: Omnitrader. |
| |
| My final chart is a daily Omnitrader chart showing a buy signal given on July 18th and repeated on July 24th. With both the RSI14 and the TDIJak indicators having given buy signals, I would have bought the shares with a target of the upper outside band at $38.07. Do note the previous history of the Vote line which suggested profitable buy and sell signals. HomeAway, Inc. looks like a share that could be followed and bought at the present price. However, because the share price at $35.57 is close to the target price of $38.07, I would keep my stops close. |
Has been a technical analyst since 1969, and has worked as a futures and options trader with First Financial Futures in Johannesburg, South Africa.
| Address: | 3256 West 24th Ave |
| Vancouver, BC | |
| Phone # for sales: | 6042634214 |
| E-mail address: | petroosp@gmail.com |
Click here for more information about our publications!
PRINT THIS ARTICLE

Request Information From Our Sponsors
- StockCharts.com, Inc.
- Candle Patterns
- Candlestick Charting Explained
- Intermarket Technical Analysis
- John Murphy on Chart Analysis
- John Murphy's Chart Pattern Recognition
- John Murphy's Market Message
- MurphyExplainsMarketAnalysis-Intermarket Analysis
- MurphyExplainsMarketAnalysis-Visual Analysis
- StockCharts.com
- Technical Analysis of the Financial Markets
- The Visual Investor
- VectorVest, Inc.
- Executive Premier Workshop
- One-Day Options Course
- OptionsPro
- Retirement Income Workshop
- Sure-Fire Trading Systems (VectorVest, Inc.)
- Trading as a Business Workshop
- VectorVest 7 EOD
- VectorVest 7 RealTime/IntraDay
- VectorVest AutoTester
- VectorVest Educational Services
- VectorVest OnLine
- VectorVest Options Analyzer
- VectorVest ProGraphics v6.0
- VectorVest ProTrader 7
- VectorVest RealTime Derby Tool
- VectorVest Simulator
- VectorVest Variator
- VectorVest Watchdog
