HOT TOPICS LIST
- MACD
- Fibonacci
- RSI
- Gann
- ADXR
- Stochastics
- Volume
- Triangles
- Futures
- Cycles
- Volatility
- ZIGZAG
- MESA
- Retracement
- Aroon
INDICATORS LIST
LIST OF TOPICS
PRINT THIS ARTICLE
by Koos van der Merwe
On May 6, 2014 I discussed the stock of Amazon, Inc. But did things turn out the way I thought they would?
Position: Accumulate
Koos van der Merwe
Has been a technical analyst since 1969, and has worked as a futures and options trader with First Financial Futures in Johannesburg, South Africa.
PRINT THIS ARTICLE
TECHNICAL INDICATORS
Amazon, Inc.
07/30/14 04:36:55 PMby Koos van der Merwe
On May 6, 2014 I discussed the stock of Amazon, Inc. But did things turn out the way I thought they would?
Position: Accumulate
| I concluded that buying a share when everyone is selling takes courage. It is always better to buy a share as it rises rather than as it is falling. Amazon (AMZN) is a stock that is on my watch list for a long term buy & hold. I was wrong. Amazon was a buy, but a short-term buy, not a long-term buy & hold. On July 24, 2014, AMZN announced results for its second quarter that ended June 30, 2014. Although their net sales increased by 23% to $19.34 billion in the second quarter, their operating loss was $15 million compared with operating income of $79 million in the second quarter 2013. Their net loss was $126 million in the second quarter, or $0.27 per diluted share, compared with net loss of $7 million, or $0.02 per diluted share, in second quarter 2013. The share price dropped 10.04% on the news. Is Amazon now a buy or is it a stock to stay away from? |

|
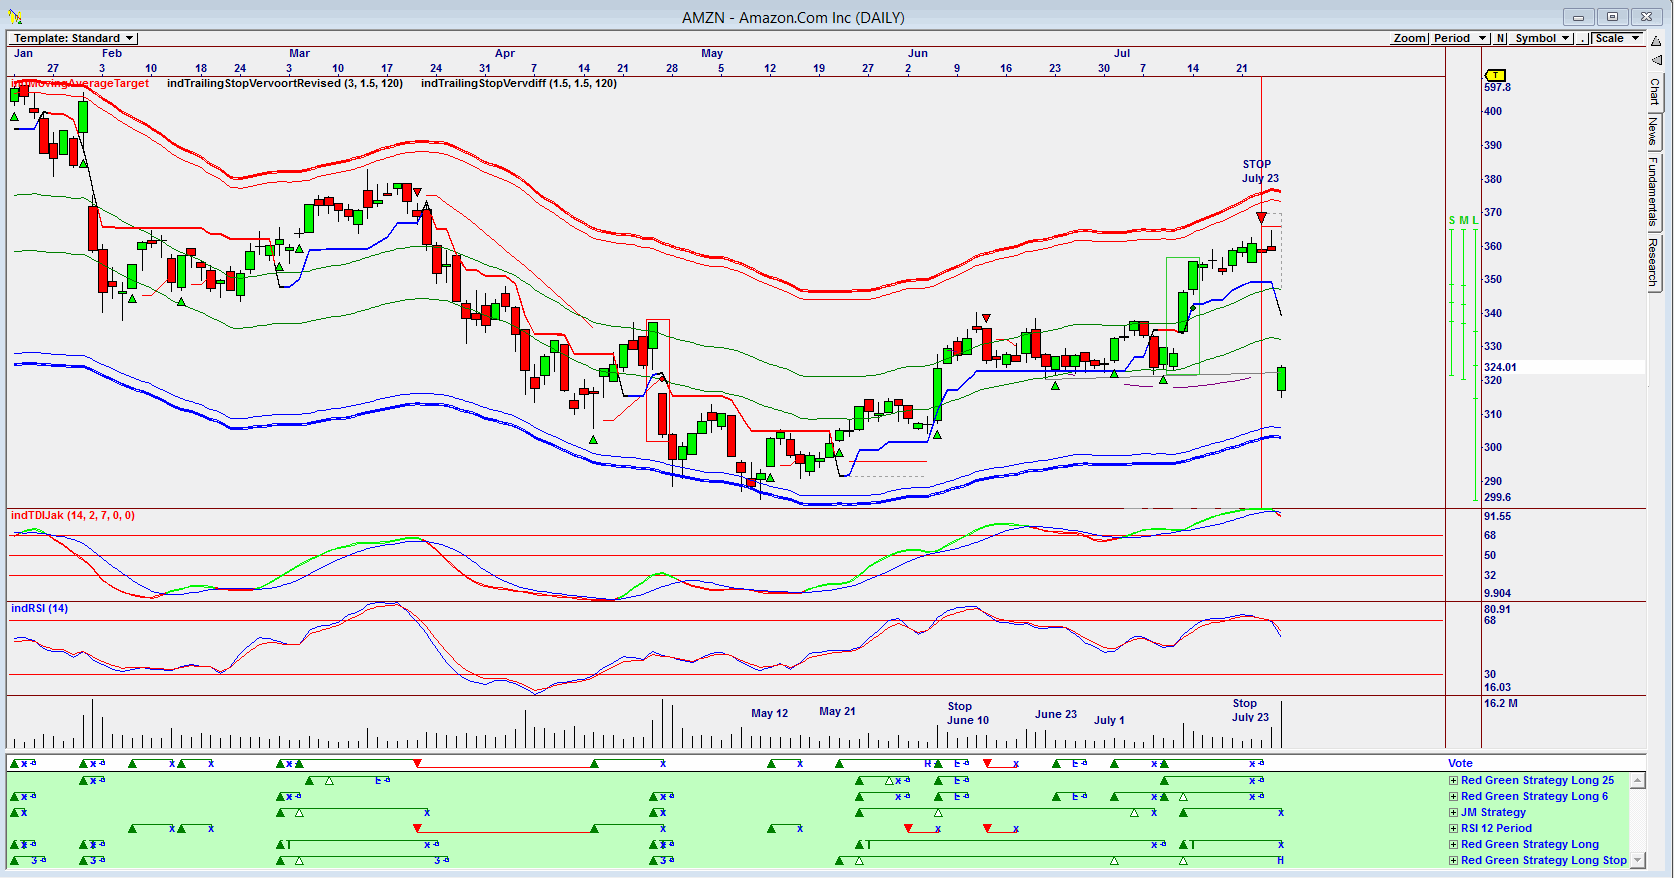
| Figure 1. Omnitrader chart of AMZN with the Vote line showing a sell signal one day before the collapse of the share price. |
| Graphic provided by: Omnitrader. |
| |
| The chart in Figure 1 is a daily Omnitrader chart of AMZN. The Vote line on the chart shows a buy signal given on July 1, 2014 and a stop signal on July 23, 2014. The signals on the Vote line have been surprisingly accurate. They are based on the strategies shown in green below the Vote line. The stop signal on July 23, 2014 would have taken you out of the share one day ahead of the second quarter announcement of an operating loss that saw the price fall. |

|
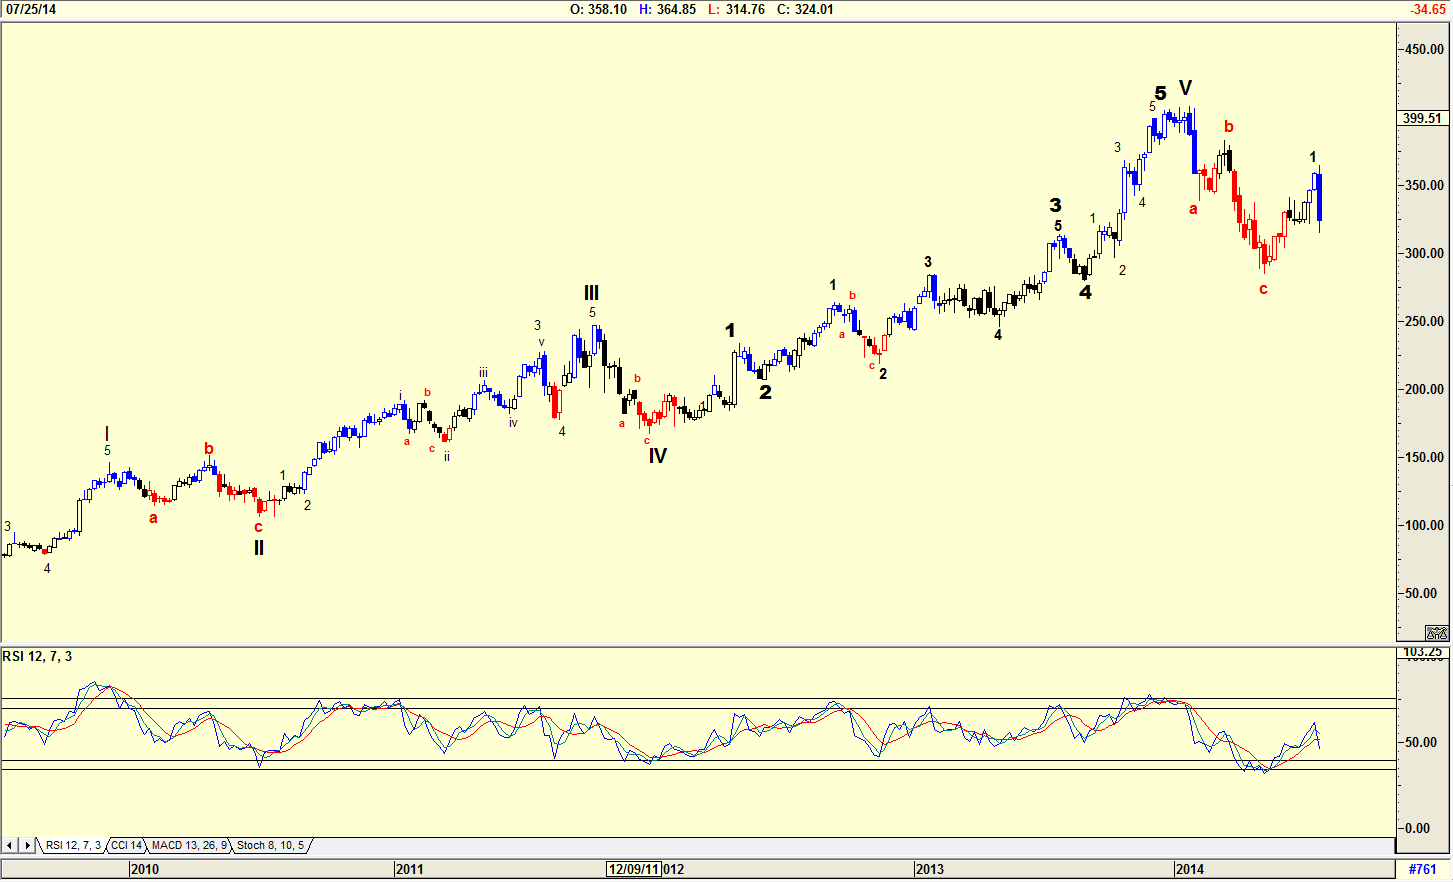
| Figure 2. Weekly chart of AMZN showing an Elliott wave count. |
| Graphic provided by: AdvancedGET. |
| |
| The weekly chart with an Elliott wave count did not give an advance warning of the correction in the share price on July 25, 2014. The relative strength index (RSI) is in a buy trend as the share price rose in a WAVE 1. |

|
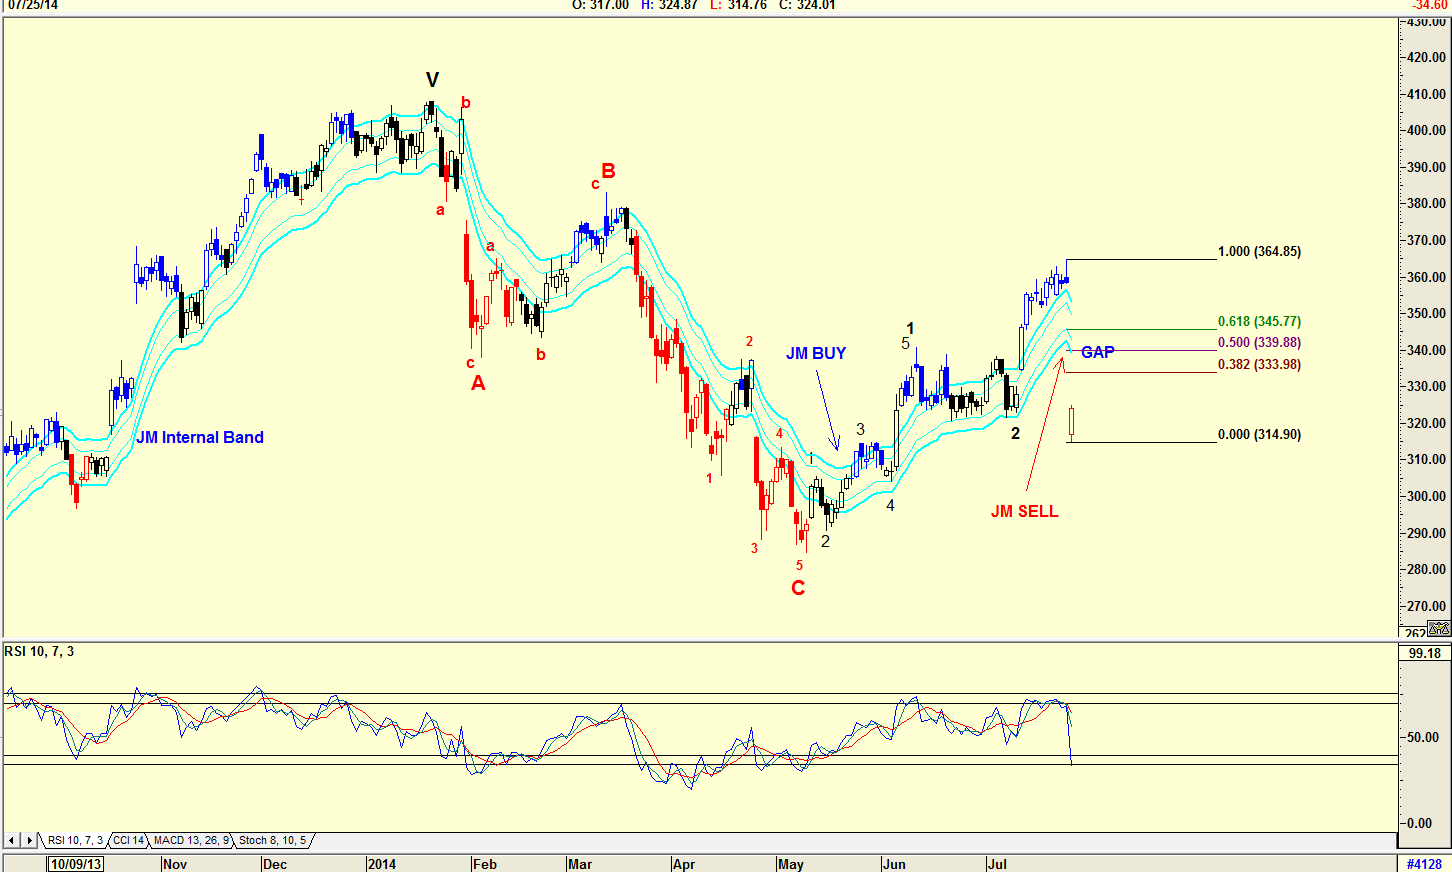
| Figure 3. Daily chart of AMZN showing a gap that could be filled. |
| Graphic provided by: AdvancedGET. |
| |
| The daily chart showing an Elliott wave count suggests that a major ABC correction has been completed and that the share price was rising in a Wave 3. The collapse of the share price on a gap on July 25, 2014 suggests that the Elliott wave count may be changed. You must never forget that an Elliott wave count is a signpost and can change a little way down the road. What the changed count will be cannot be determined at this point in time. We do know that the RSI is now at the overbought level. There is also a gap, and the price should form a base and start rising to fill the gap. The Fibonacci levels suggest a target the price could rise to. Note that the JM Internal Band is a 15-period simple moving average offset by 2% positive and 2% negative. With the collapse in the share price, a JM Internal Band sell signal has been given. And yes, I would be a buyer of AMZN at the present price, taking a gamble that the share price will rise to fill the gap. However, common sense tells me to wait for a buy signal from the Omnitrader chart even if it is late, as the signals have been very accurate. |
Has been a technical analyst since 1969, and has worked as a futures and options trader with First Financial Futures in Johannesburg, South Africa.
| Address: | 3256 West 24th Ave |
| Vancouver, BC | |
| Phone # for sales: | 6042634214 |
| E-mail address: | petroosp@gmail.com |
Click here for more information about our publications!
PRINT THIS ARTICLE

|

Request Information From Our Sponsors
- VectorVest, Inc.
- Executive Premier Workshop
- One-Day Options Course
- OptionsPro
- Retirement Income Workshop
- Sure-Fire Trading Systems (VectorVest, Inc.)
- Trading as a Business Workshop
- VectorVest 7 EOD
- VectorVest 7 RealTime/IntraDay
- VectorVest AutoTester
- VectorVest Educational Services
- VectorVest OnLine
- VectorVest Options Analyzer
- VectorVest ProGraphics v6.0
- VectorVest ProTrader 7
- VectorVest RealTime Derby Tool
- VectorVest Simulator
- VectorVest Variator
- VectorVest Watchdog
- StockCharts.com, Inc.
- Candle Patterns
- Candlestick Charting Explained
- Intermarket Technical Analysis
- John Murphy on Chart Analysis
- John Murphy's Chart Pattern Recognition
- John Murphy's Market Message
- MurphyExplainsMarketAnalysis-Intermarket Analysis
- MurphyExplainsMarketAnalysis-Visual Analysis
- StockCharts.com
- Technical Analysis of the Financial Markets
- The Visual Investor
