HOT TOPICS LIST
- MACD
- Fibonacci
- RSI
- Gann
- ADXR
- Stochastics
- Volume
- Triangles
- Futures
- Cycles
- Volatility
- ZIGZAG
- MESA
- Retracement
- Aroon
INDICATORS LIST
LIST OF TOPICS
PRINT THIS ARTICLE
by Donald W. Pendergast, Jr.
Shares of Mead Westvaco Corp. appear to be pausing in a small sideways range before making yet another attempt to continue upward.
Position: N/A
Donald W. Pendergast, Jr.
Freelance financial markets writer and online publisher of the Trendzetterz.com S&P 500 Weekly Forecast service.
PRINT THIS ARTICLE
CHART ANALYSIS
MWV: Bullish Continuation Setup
07/30/14 04:30:03 PMby Donald W. Pendergast, Jr.
Shares of Mead Westvaco Corp. appear to be pausing in a small sideways range before making yet another attempt to continue upward.
Position: N/A
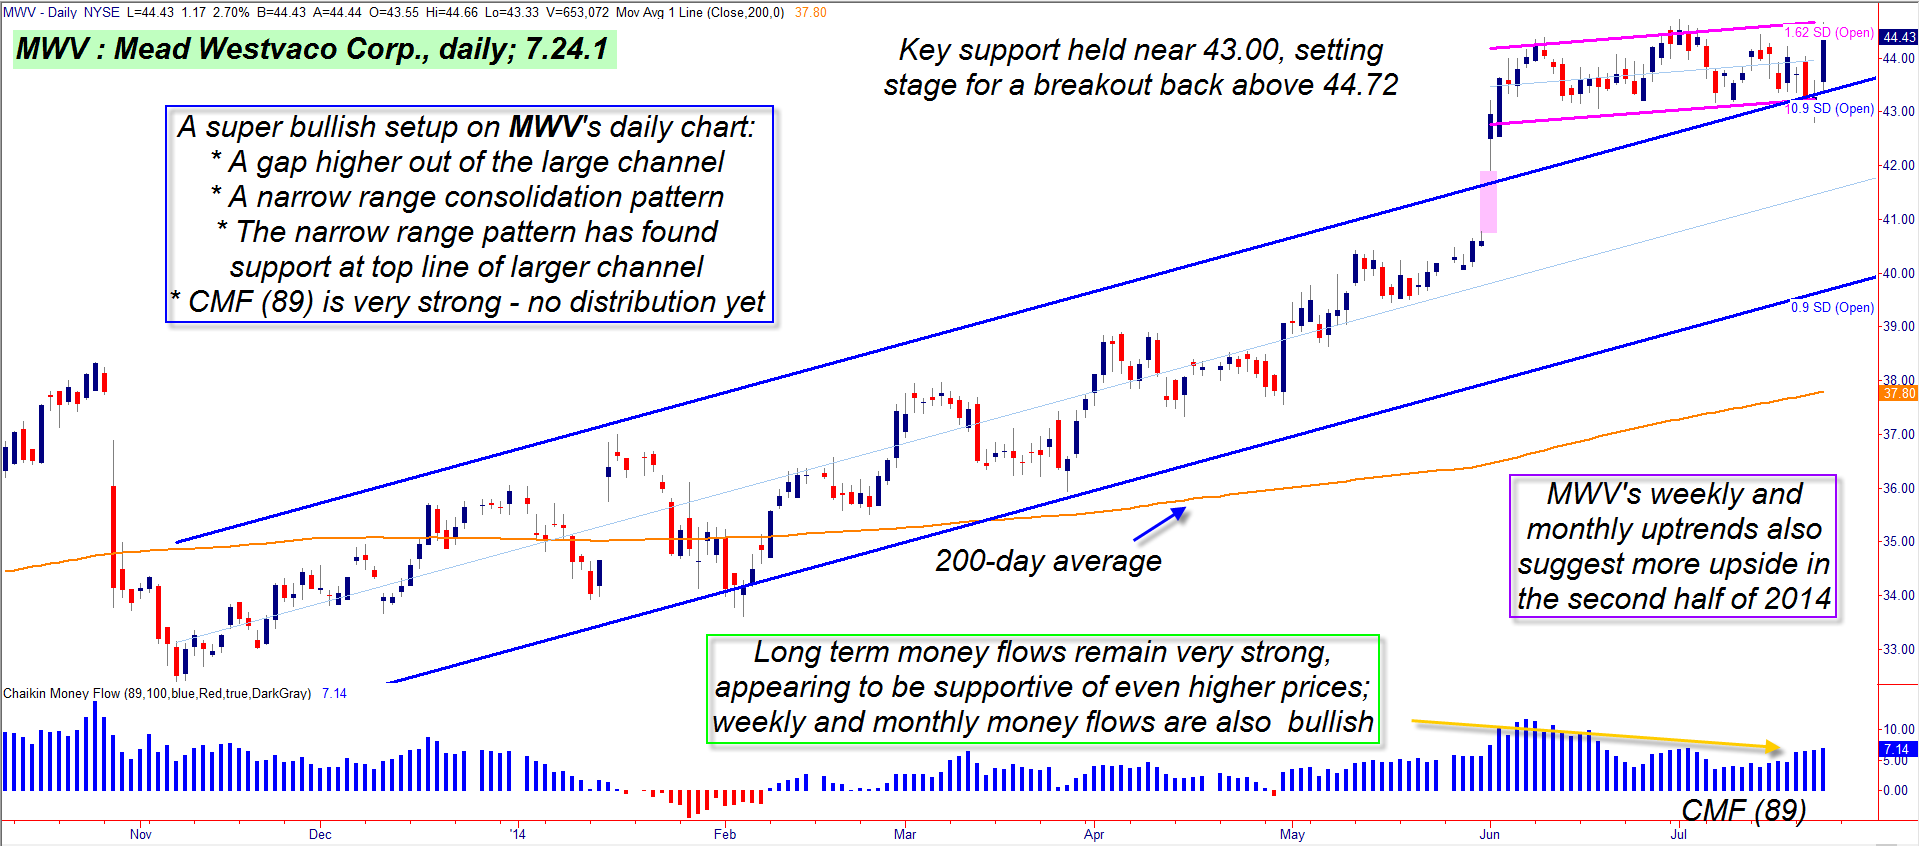
| Mead Westvaco Corp.'s latest surge has its root in the set of cycle lows established in early November 2013; from that low of 32.38, the stock has made it all the way to 44.25 — a gain of nearly 37% in less than eight months. For a basic materials, large cap paper manufacturer that's a pretty good move, and for the bulls there may be even more good news ahead as the stock consolidates prior to what might just be another powerful upsurge. Here's a closer look (Figure 1). |

|
| Figure 1. Mead Westvaco Corp. (MWV): Once the stock gapped up out of the larger channel, there was little doubt that the "smart money" was firmly in control of this uptrend. A daily close above 44.72 sets up the potential for a continuation move toward the 50.00 area. |
| Graphic provided by: TradeStation. |
| |
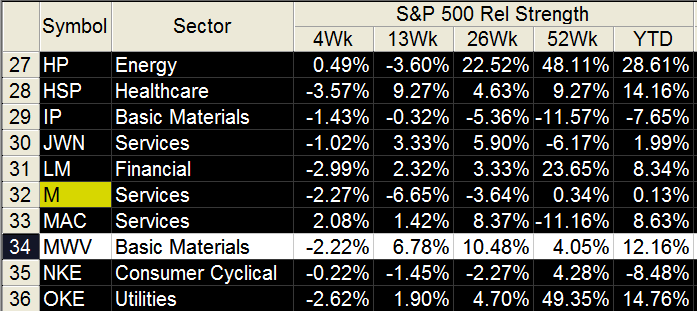
| The November 2013 multicycle low is the base for the large linear regression channel; the bullish trend that evolved over the past seven and a half months has been stable, with modest pullbacks leading to subsequent bullish swings that keep stair-stepping ever higher. Then came the large bull gap of June 2, 2014 — a major vote of confidence by the "smart money" institutional traders in this issue, one that propelled MWV completely out of and above the entire channel — which has now led to the very narrow range channel in which it now finds itself. This is an exceptionally bullish trade setup, and one that could lead to a powerful continuation move up toward the 50.00 price level in the near future. Here are the basic dynamics involved: 1. The long-term Chaikin Money Flow (CMF)(89) histogram is in terrifically bullish shape, very supportive of yet another thrust higher. 2. The weekly and monthly money flow histograms are also mega-bullish, as are the basic trends for each respective time frame. 3. Note how the lower right boundary of the pink consolidation channel coincides with the 43.00 price level (a key support price for MWV) and that the extended upper right channel line of the large pattern also meets up with the smaller pattern at exactly the same price. Also note the strong intraday bullish reversal off the 43.00 area on Thursday July 25, 2014. 4. MWV has been outperforming the .SPX (S&P 500 index) over the past 13-, 26- and 52-week periods and that it is also performing stronger than the .SPX year to date (YTD). All that's needed to validate this setup is a daily break and close above 44.72 within the next few trading sessions. |

|
| Figure 2. MWV has been steadily outperforming the .SPX (S&P 500 index) for the past year and is also very strong year-to-date. |
| Graphic provided by: TradeStation. |
| Graphic provided by: TradeStation RadarScreen. |
| |
| Traders can play this as a straight breakout/swing trade, as follows: A. On a daily close above 44.72, go long at the next open, running a three bar trailing stop of the daily lows. Such a trailing stop can help you limit losses while keeping you in for any new up thrusts into the upper 40.00 zone. B. Any fast move up to 48.50 or higher might signal an opportune time to take at least partial profits just in case. C. Account risk should be 2% or less of your equity, keeping in mind that the Dow 30 and S&P 500 are again near their all-time highs; keeping risk closer to 1% might be a wise thing to do here. Even though this is a high-probability, low risk trade setup, it's still up to you to manage the trade properly and to keep your account risks modest. In the end, only you can be the one who decides to trade wisely — in any and every kind of market scenario. See you again here soon. |
Freelance financial markets writer and online publisher of the Trendzetterz.com S&P 500 Weekly Forecast service.
| Title: | Market consultant and writer |
| Company: | Trendzetterz |
| Address: | 81 Hickory Hollow Drive |
| Crossville, TN 38555 | |
| Phone # for sales: | 904-303-4814 |
| Website: | trendzetterz.com |
| E-mail address: | support@trendzetterz.com |
Traders' Resource Links | |
| Trendzetterz has not added any product or service information to TRADERS' RESOURCE. | |
Click here for more information about our publications!
PRINT THIS ARTICLE

Request Information From Our Sponsors
- StockCharts.com, Inc.
- Candle Patterns
- Candlestick Charting Explained
- Intermarket Technical Analysis
- John Murphy on Chart Analysis
- John Murphy's Chart Pattern Recognition
- John Murphy's Market Message
- MurphyExplainsMarketAnalysis-Intermarket Analysis
- MurphyExplainsMarketAnalysis-Visual Analysis
- StockCharts.com
- Technical Analysis of the Financial Markets
- The Visual Investor
- VectorVest, Inc.
- Executive Premier Workshop
- One-Day Options Course
- OptionsPro
- Retirement Income Workshop
- Sure-Fire Trading Systems (VectorVest, Inc.)
- Trading as a Business Workshop
- VectorVest 7 EOD
- VectorVest 7 RealTime/IntraDay
- VectorVest AutoTester
- VectorVest Educational Services
- VectorVest OnLine
- VectorVest Options Analyzer
- VectorVest ProGraphics v6.0
- VectorVest ProTrader 7
- VectorVest RealTime Derby Tool
- VectorVest Simulator
- VectorVest Variator
- VectorVest Watchdog
