HOT TOPICS LIST
- MACD
- Fibonacci
- RSI
- Gann
- ADXR
- Stochastics
- Volume
- Triangles
- Futures
- Cycles
- Volatility
- ZIGZAG
- MESA
- Retracement
- Aroon
INDICATORS LIST
LIST OF TOPICS
PRINT THIS ARTICLE
by Koos van der Merwe
When a share rises off a double bottom it is worth a watch.
Position: Accumulate
Koos van der Merwe
Has been a technical analyst since 1969, and has worked as a futures and options trader with First Financial Futures in Johannesburg, South Africa.
PRINT THIS ARTICLE
DOUBLE BOTTOMS
A Double Bottom To Watch
07/30/14 04:18:13 PMby Koos van der Merwe
When a share rises off a double bottom it is worth a watch.
Position: Accumulate
| A double bottom appears as a "W" on a chart. It is a popular formation among analysts, but the pattern can be misinterpreted by many analysts, so care should be taken when such a formation appears. You should only react to a confirmation of a double bottom when the internal "A" of the "W" formation is broken. |

|
| Figure 1. Weekly chart of TLM. |
| Graphic provided by: AdvancedGET. |
| |
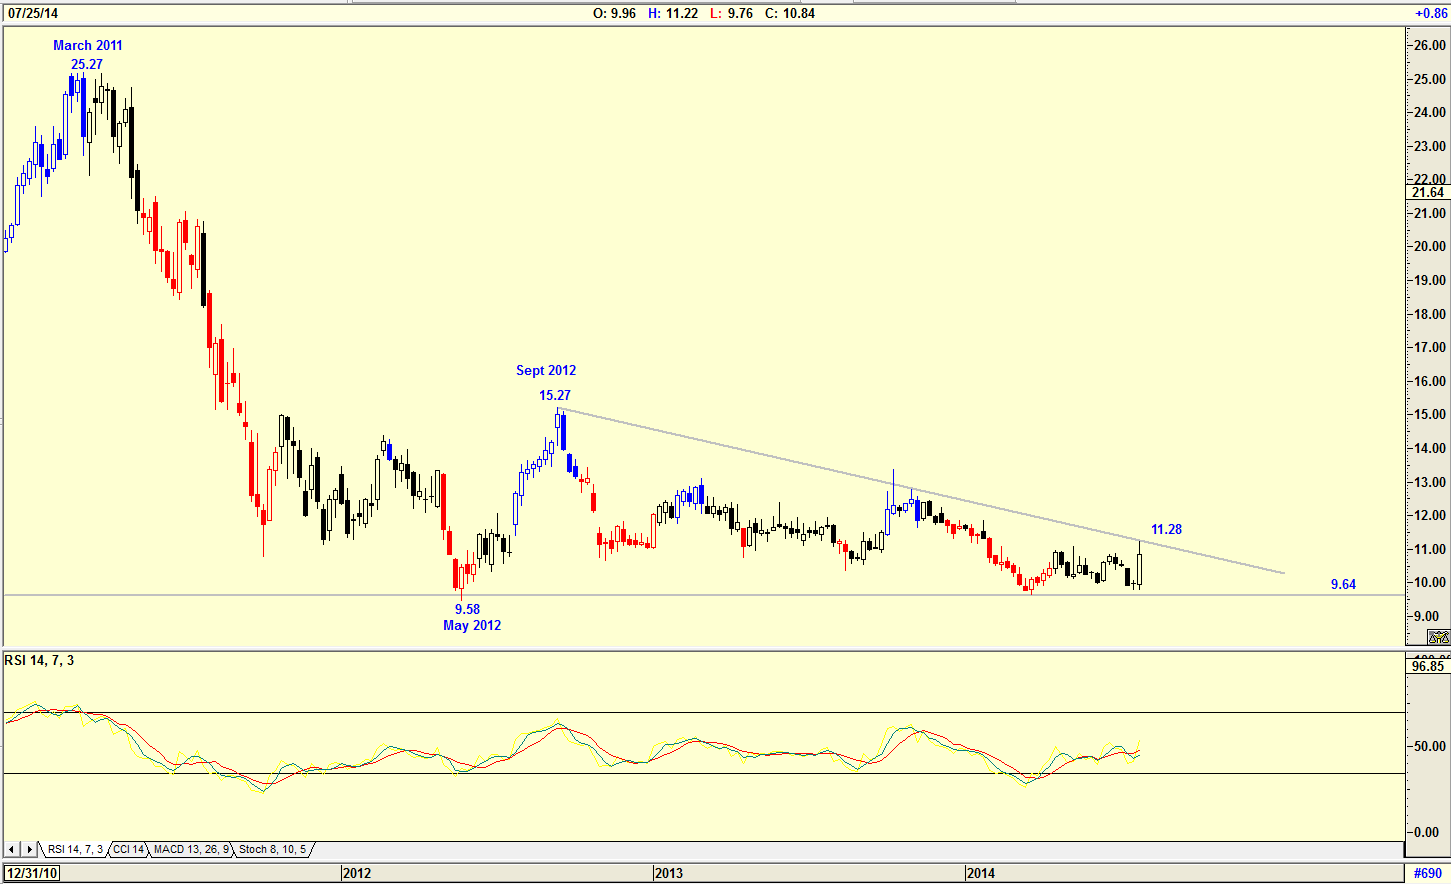
| The chart in Figure 1 is a weekly chart of Talisman Energy (TLM) showing how the share price has fallen from a high of $25.27 in March 2011 to a low of $9.58 by May 2012. The price then rose to $15.27 by September 2012 and then fell to retest the low of $9.64 forming what appears to be a wedge. However, with the horizontal base at $9.64 the pattern is not a wedge but can represent major support for the share price. With the price presently testing the upper band at $11.28, a buy signal could be given should it break above the upper trend line. The rising relative strength (RSI) suggests that this could indeed occur. |

|
| Figure 2. Daily chart of TLM showing the possible double bottom formation. |
| Graphic provided by: AdvancedGET. |
| |
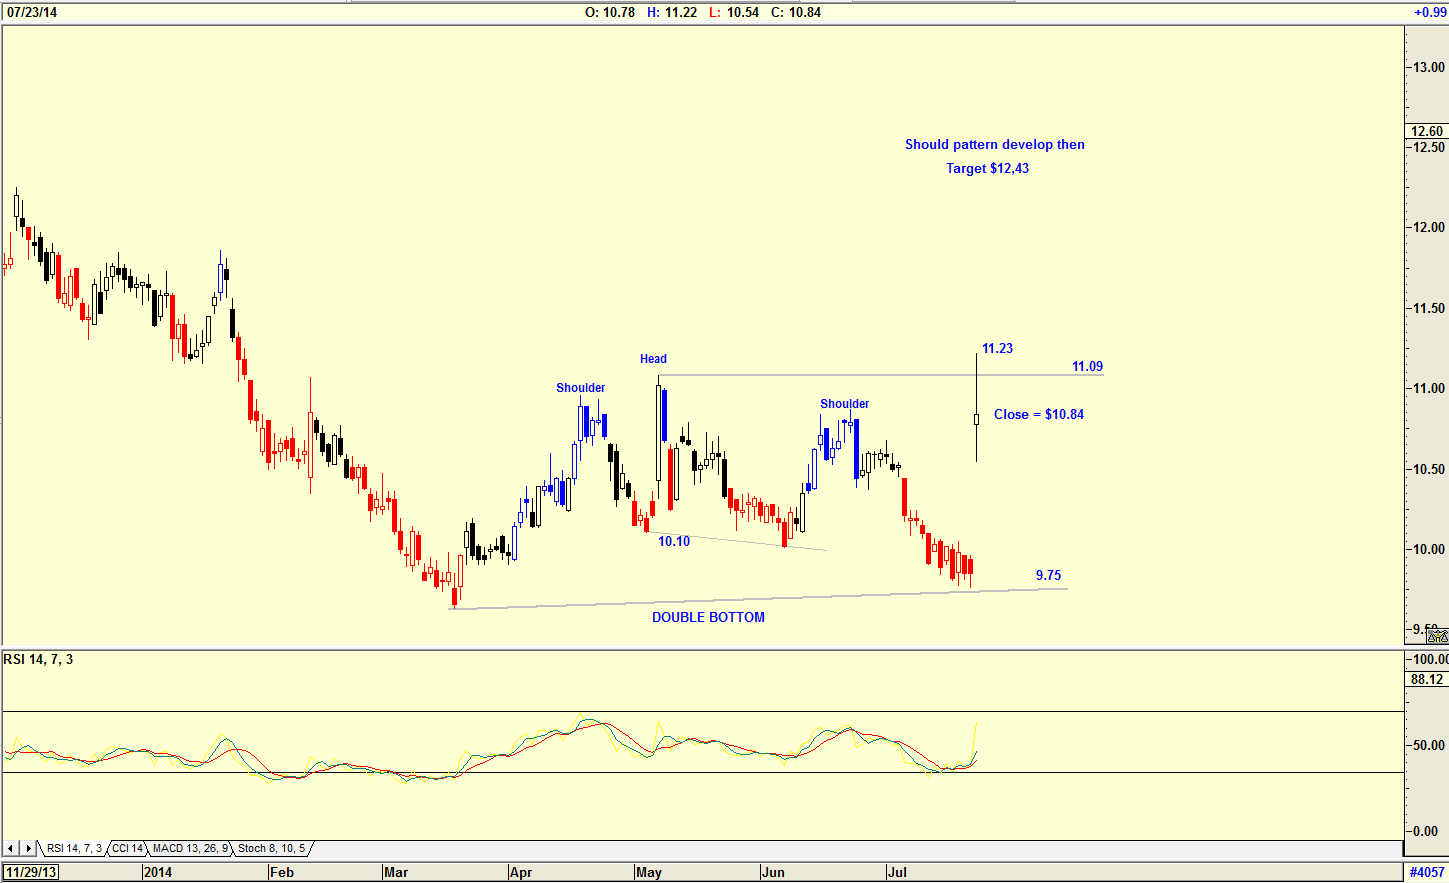
| The chart in Figure 2 is a daily chart showing the double bottom pattern that has formed. With the rise of the price to a high of $11.23 the pattern could be suggesting that a buy signal may occur in the near future. The closing price however, must be above $11.09 to trigger a buy. With the RSI having given a buy, this is indeed possible. Note that the formation also suggests a head & shoulders pattern, but because this pattern formed after a falling price, its credibility is doubtful. I would not be a buyer of TLM until the closing price breaks above $11.09. Should this occur, the target for the share price will be $12.43 (11.09-9.75=1.34 + 11.09 = 12.43). |
Has been a technical analyst since 1969, and has worked as a futures and options trader with First Financial Futures in Johannesburg, South Africa.
| Address: | 3256 West 24th Ave |
| Vancouver, BC | |
| Phone # for sales: | 6042634214 |
| E-mail address: | petroosp@gmail.com |
Click here for more information about our publications!
PRINT THIS ARTICLE

Request Information From Our Sponsors
- StockCharts.com, Inc.
- Candle Patterns
- Candlestick Charting Explained
- Intermarket Technical Analysis
- John Murphy on Chart Analysis
- John Murphy's Chart Pattern Recognition
- John Murphy's Market Message
- MurphyExplainsMarketAnalysis-Intermarket Analysis
- MurphyExplainsMarketAnalysis-Visual Analysis
- StockCharts.com
- Technical Analysis of the Financial Markets
- The Visual Investor
- VectorVest, Inc.
- Executive Premier Workshop
- One-Day Options Course
- OptionsPro
- Retirement Income Workshop
- Sure-Fire Trading Systems (VectorVest, Inc.)
- Trading as a Business Workshop
- VectorVest 7 EOD
- VectorVest 7 RealTime/IntraDay
- VectorVest AutoTester
- VectorVest Educational Services
- VectorVest OnLine
- VectorVest Options Analyzer
- VectorVest ProGraphics v6.0
- VectorVest ProTrader 7
- VectorVest RealTime Derby Tool
- VectorVest Simulator
- VectorVest Variator
- VectorVest Watchdog
