HOT TOPICS LIST
- MACD
- Fibonacci
- RSI
- Gann
- ADXR
- Stochastics
- Volume
- Triangles
- Futures
- Cycles
- Volatility
- ZIGZAG
- MESA
- Retracement
- Aroon
INDICATORS LIST
LIST OF TOPICS
PRINT THIS ARTICLE
by David Penn
The summer ascending triangle breakout runs into a head and shoulders top.
Position: N/A
David Penn
Technical Writer for Technical Analysis of STOCKS & COMMODITIES magazine, Working-Money.com, and Traders.com Advantage.
PRINT THIS ARTICLE
HEAD & SHOULDERS
A Head and Shoulders Top in Crude
10/21/02 08:37:49 AMby David Penn
The summer ascending triangle breakout runs into a head and shoulders top.
Position: N/A
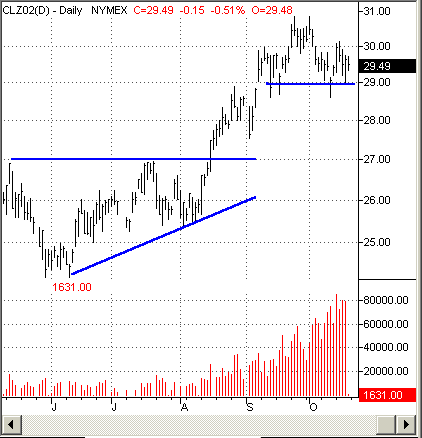
| Back in August, I noted an ascending triangle formation in September crude ("Crude Oil's Ascending Triangle," Traders.com; August 20, 2002). This triangle, imperfect as it may have been, accurately anticipated higher prices for crude oil and, breaking out at about 28, September crude did set new contract highs--although it did fall short of its breakout target of 33 by two dollars. This is a niggling complaint, however. A spread order that sold September crude and bought December crude on the expiration of the former on August 20th would have resulted in a gain of about $2 per contract simply in the rollover process. |
| In any event, the bullish days for crude oil appear to be dying with the Decembers. December crude topped out late in September at 30.85. A second attempt to take higher ground failed a few days later, and crude oil began gradually moving down. As of mid-October, December crude has fallen to 29.50. These attempts to establish and maintain new highs, and the subsequent collapses when these rallies failed, have set up a potential head and shoulders top in December crude. |

|
| Figure 1: What the ascending triangle gave, a head and shoulders top may take away. |
| Graphic provided by: TradeStation. |
| |
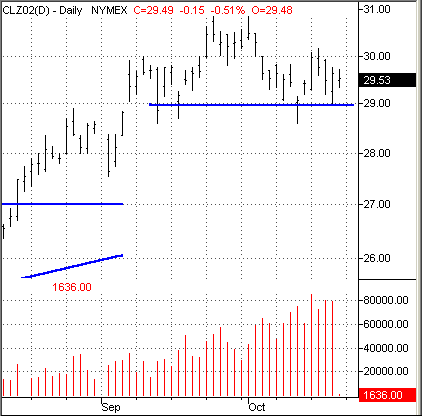
| Inasmuch as the size of the head and shoulders top provides clues to the size of any post-break move, this autumn head and shoulders size of about 2 points suggests that a break beneath 29 will likely take crude back to the ascending triangle breakout area of 27. |
 Figure 2: A close-up of the autumn head and shoulders top in December crude. Should crude oil descend back beneath 27, then it stands a good chance of consolidating between 27 and 25, where a great deal of price support developed over the summer. A consolidation in this area could lead to higher prices--a scenario in which crude oil rebounds from the 27 area and makes another attempt at breaching 31 (basis December). At the same time, a consolidation could set the stage for even more dramatic declines--should the 27-25 range turn out to be a distribution area. |
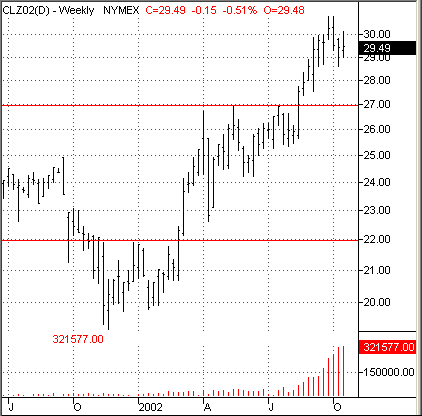
 Figure 3: Support levels based on breakouts from previous triangles. Does this hold any longer-term bearish significance for crude oil? One longer-term look based loosely on Elliott wave counts suggests so. For those not interested in such a perspective, consider the fact that, as Figure 1 partially shows, the next area of support for crude beneath the 27-25 consolidation is the top of the ascending triangle bottom at 22. In the wake of a temporary breakdown in crude, any resumption of the bullish trend would need to find support at one of these levels. |
Technical Writer for Technical Analysis of STOCKS & COMMODITIES magazine, Working-Money.com, and Traders.com Advantage.
| Title: | Technical Writer |
| Company: | Technical Analysis, Inc. |
| Address: | 4757 California Avenue SW |
| Seattle, WA 98116 | |
| Phone # for sales: | 206 938 0570 |
| Fax: | 206 938 1307 |
| Website: | www.Traders.com |
| E-mail address: | DPenn@traders.com |
Traders' Resource Links | |
| Charting the Stock Market: The Wyckoff Method -- Books | |
| Working-Money.com -- Online Trading Services | |
| Traders.com Advantage -- Online Trading Services | |
| Technical Analysis of Stocks & Commodities -- Publications and Newsletters | |
| Working Money, at Working-Money.com -- Publications and Newsletters | |
| Traders.com Advantage -- Publications and Newsletters | |
| Professional Traders Starter Kit -- Software | |
Click here for more information about our publications!
Comments
Date: 10/22/02Rank: 2Comment: the first graph DOES NOT show the 22 aera clearly.
Date: 11/12/02Rank: 5Comment:

Request Information From Our Sponsors
- StockCharts.com, Inc.
- Candle Patterns
- Candlestick Charting Explained
- Intermarket Technical Analysis
- John Murphy on Chart Analysis
- John Murphy's Chart Pattern Recognition
- John Murphy's Market Message
- MurphyExplainsMarketAnalysis-Intermarket Analysis
- MurphyExplainsMarketAnalysis-Visual Analysis
- StockCharts.com
- Technical Analysis of the Financial Markets
- The Visual Investor
- VectorVest, Inc.
- Executive Premier Workshop
- One-Day Options Course
- OptionsPro
- Retirement Income Workshop
- Sure-Fire Trading Systems (VectorVest, Inc.)
- Trading as a Business Workshop
- VectorVest 7 EOD
- VectorVest 7 RealTime/IntraDay
- VectorVest AutoTester
- VectorVest Educational Services
- VectorVest OnLine
- VectorVest Options Analyzer
- VectorVest ProGraphics v6.0
- VectorVest ProTrader 7
- VectorVest RealTime Derby Tool
- VectorVest Simulator
- VectorVest Variator
- VectorVest Watchdog
