HOT TOPICS LIST
- MACD
- Fibonacci
- RSI
- Gann
- ADXR
- Stochastics
- Volume
- Triangles
- Futures
- Cycles
- Volatility
- ZIGZAG
- MESA
- Retracement
- Aroon
INDICATORS LIST
LIST OF TOPICS
PRINT THIS ARTICLE
by Koos van der Merwe
Here's a company that started off in South Africa and has become an international player. Is it a buy?
Position: Buy
Koos van der Merwe
Has been a technical analyst since 1969, and has worked as a futures and options trader with First Financial Futures in Johannesburg, South Africa.
PRINT THIS ARTICLE
TECHNICAL ANALYSIS
Sasol
07/23/14 03:41:24 PMby Koos van der Merwe
Here's a company that started off in South Africa and has become an international player. Is it a buy?
Position: Buy
| Today Sasol (SSL) is an international integrated energy and chemical company with more than 34,000 people working in 37 countries. Committed to their home-base in South Africa, they are expanding internationally. They are one of the world's largest producers of synthetic fuels. They mine coal in South Africa and refine imported crude oil. In Mozambique they produce natural gas and condensate and in Canada they produce shale gas. The shares of the company are listed on the Johannesburg and New York stock exchanges. |

|
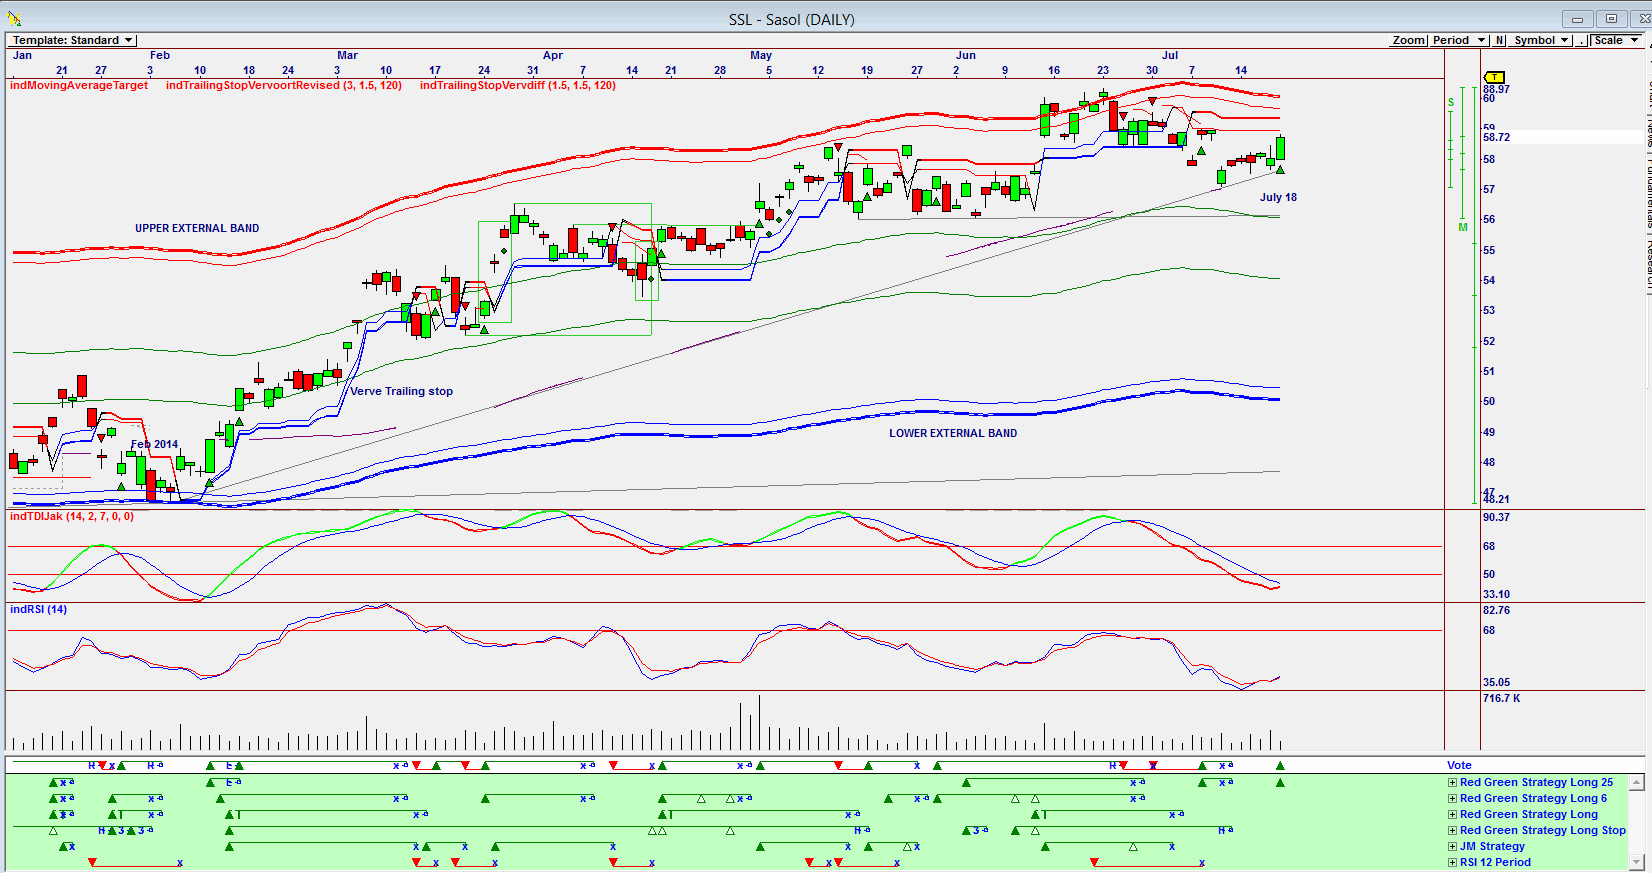
| Figure 1. Omnitrader chart showing a buy signal. |
| Graphic provided by: Omnitrader. |
| |
| The chart in Figure 1 is an Omnitrader chart showing how the share price has risen from $46.74 in February 2014 to a high of $76 21 by June 2014. The chart shows how the share price rose from the lower external band to the upper external band with buy and sell signals shown on the Vote line. With a new buy signal given on July 18, 2014 — a signal triggered by the Red Green strategy long 25 shown in green below the vote line — you would be tempted to buy the share. The Red Green Strategy Long 25 is a strategy based on today's close breaking above the high of 25 days ago. What also looks interesting are the two indicators &mdas; the 14-period relative strength index (RSI), which has given a buy and the indTDIJak which looks close to giving a buy. The stock is below the Verve trailing stop, another sign that the share could be a buy because the stop should fall and trail the price. |

|
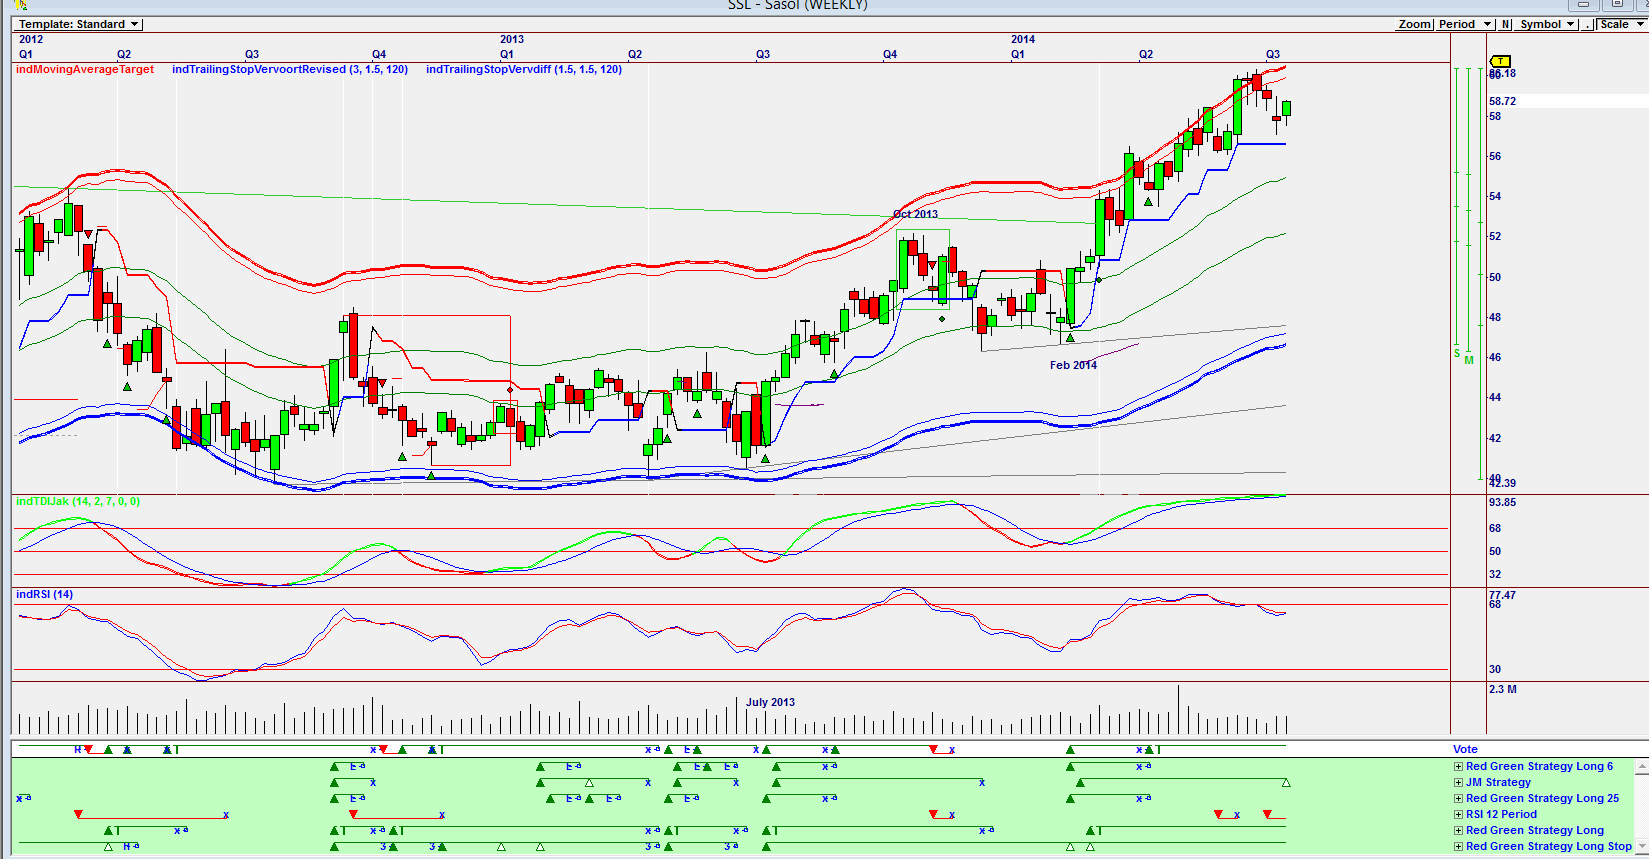
| Figure 2. Weekly Omnitrader chart showing buy signals. |
| Graphic provided by: Omnitrader. |
| |
| The chart in Figure 2 is a weekly Omnitrader chart showing how the Vote line gave a buy signal in February 2014 based on basically all the strategies shown in green below the Vote line. Note that the Red Green Strategy Long stop gave a buy signal with all the other strategies, but remained in a long position even though there was a correction from October 2013 with a sell signal triggered by the 12-period RSI. The two indicators are suggesting weakness. |

|
| Figure 3. Daily chart showing the Elliott wave count. |
| Graphic provided by: AdvancedGET. |
| |
| The chart in Figure 3 is a daily chart showing an Elliott Wave count that suggests that the share price has completed an ABC correction after a five wave rise. The share price has probably risen in a Wave 1 and broken above the 30 period moving average of the (high + low + close)/3 which acted as good trend follower. The moving average convergence/divergence (MACD) indicator is turning suggesting that a buy signal could soon be triggered. I would be a buyer of SSL at the present price knowing that it would be a short-term trade and that the share price, once wave 1 is completed, would fall in a wave 2 correction. |
Has been a technical analyst since 1969, and has worked as a futures and options trader with First Financial Futures in Johannesburg, South Africa.
| Address: | 3256 West 24th Ave |
| Vancouver, BC | |
| Phone # for sales: | 6042634214 |
| E-mail address: | petroosp@gmail.com |
Click here for more information about our publications!
PRINT THIS ARTICLE

Request Information From Our Sponsors
- StockCharts.com, Inc.
- Candle Patterns
- Candlestick Charting Explained
- Intermarket Technical Analysis
- John Murphy on Chart Analysis
- John Murphy's Chart Pattern Recognition
- John Murphy's Market Message
- MurphyExplainsMarketAnalysis-Intermarket Analysis
- MurphyExplainsMarketAnalysis-Visual Analysis
- StockCharts.com
- Technical Analysis of the Financial Markets
- The Visual Investor
- VectorVest, Inc.
- Executive Premier Workshop
- One-Day Options Course
- OptionsPro
- Retirement Income Workshop
- Sure-Fire Trading Systems (VectorVest, Inc.)
- Trading as a Business Workshop
- VectorVest 7 EOD
- VectorVest 7 RealTime/IntraDay
- VectorVest AutoTester
- VectorVest Educational Services
- VectorVest OnLine
- VectorVest Options Analyzer
- VectorVest ProGraphics v6.0
- VectorVest ProTrader 7
- VectorVest RealTime Derby Tool
- VectorVest Simulator
- VectorVest Variator
- VectorVest Watchdog
