HOT TOPICS LIST
- MACD
- Fibonacci
- RSI
- Gann
- ADXR
- Stochastics
- Volume
- Triangles
- Futures
- Cycles
- Volatility
- ZIGZAG
- MESA
- Retracement
- Aroon
INDICATORS LIST
LIST OF TOPICS
PRINT THIS ARTICLE
by Koos van der Merwe
Twenty-First Century Fox, Inc. (FOXA) made a bid for Time Warner, Inc. (TWX) but it was rejected.
Position: Sell
Koos van der Merwe
Has been a technical analyst since 1969, and has worked as a futures and options trader with First Financial Futures in Johannesburg, South Africa.
PRINT THIS ARTICLE
GAPS
Looking At Time Warner
07/22/14 05:23:59 PMby Koos van der Merwe
Twenty-First Century Fox, Inc. (FOXA) made a bid for Time Warner, Inc. (TWX) but it was rejected.
Position: Sell
| Rupert Murdoch's Twenty-First Century Fox Inc. (FOXA) made an offer for Time Warner Inc. (TWX). Should he succeed it would make him the most powerful magnate in U.S. media and entertainment. Time Warner rejected the $80 billion bid. Will Rupert Murdoch abandon his bid, or will he raise his offer? What do the charts say? |

|
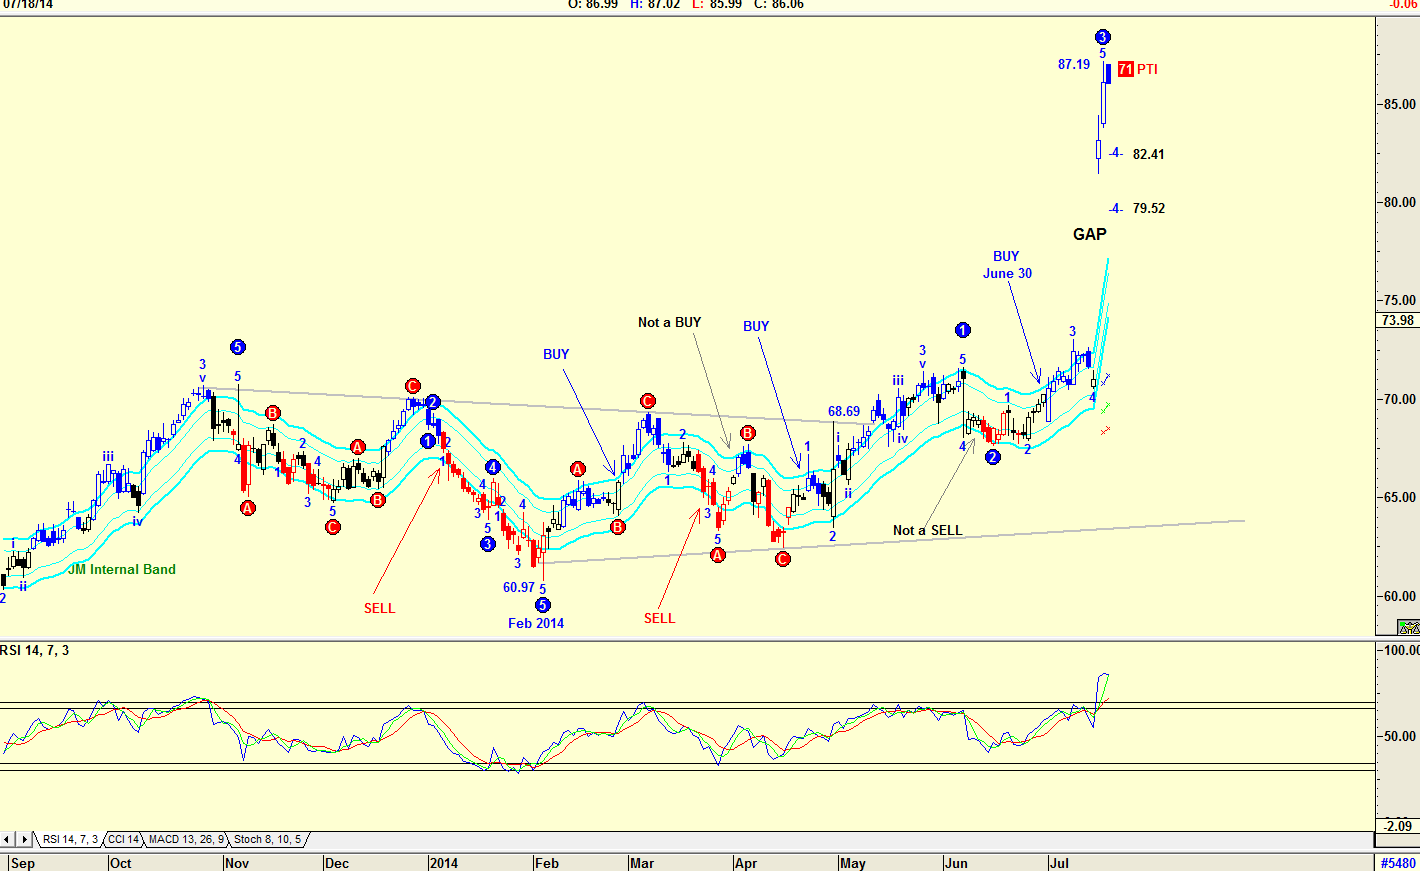
| Figure 1. Daily chart of Time Warner, Inc. (TWX) showing gap that could be filled. |
| Graphic provided by: AdvancedGET. |
| |
| The chart in Figure 1 is a daily chart of TWX showing how the price moved from a low of $60.97 in February 2014 to a high of $87.19, a rise on a gap caused by the offer made by Twenty-First Century Fox. The Elliott Wave count on the chart calculated by the Advanced GET program is complicated and could be open to correction. However, it suggests that a Wave 3 has been completed and that the share price should fall to $79.52 to fill the gap. The program is also suggesting a Probability Index (PTI) of 71, which is strong. With the RSI index at overbought levels, this seems likely. Note the buy signal given by the JM Internal Band indicator on June 30, 2014. The JM Internal Band is a 15-period simple moving average (SMA) offset by 2% positive and 2% negative. A move above the upper band with the close above the band suggests a buy signal. Note the two signals on the chart where a buy and sell were not confirmed. |

|
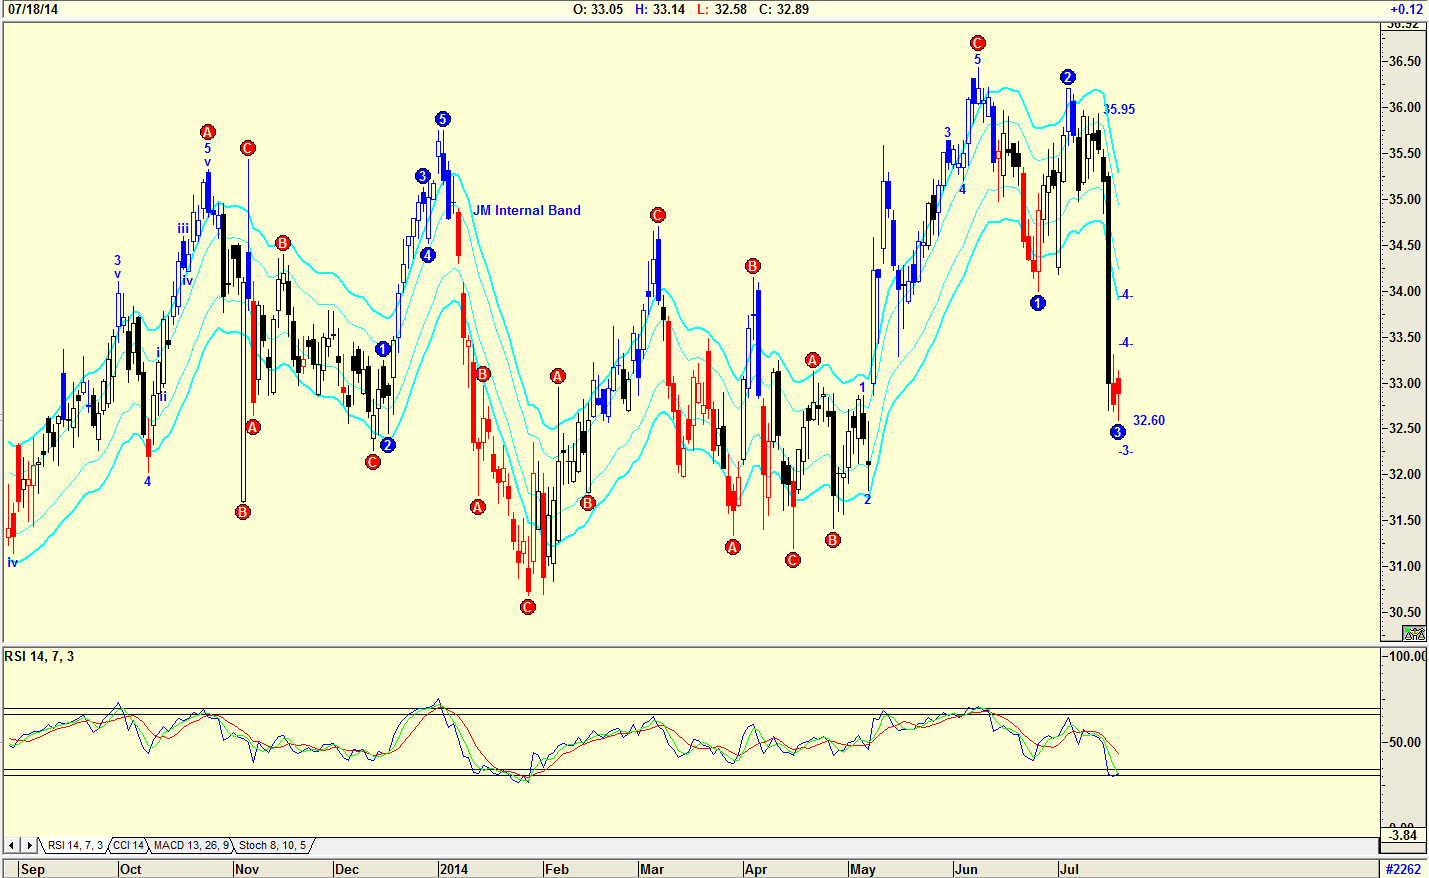
| Figure 2. Daily chart of Twenty-First Century Fox, Inc. |
| Graphic provided by: AdvancedGET. |
| |
| The chart in Figure 2 is a daily chart of FOXA with, again, a complicated Elliott Wave count suggested by the Advanced GET program. Note how the share price fell as expected from $35.95 to $32.60 when the offer for TWX was made. The relative strength index (RSI) is at oversold levels and is suggesting that a buy signal is imminent. Should this occur, it is likely that they may not increase their offer to buy TWX. |

|
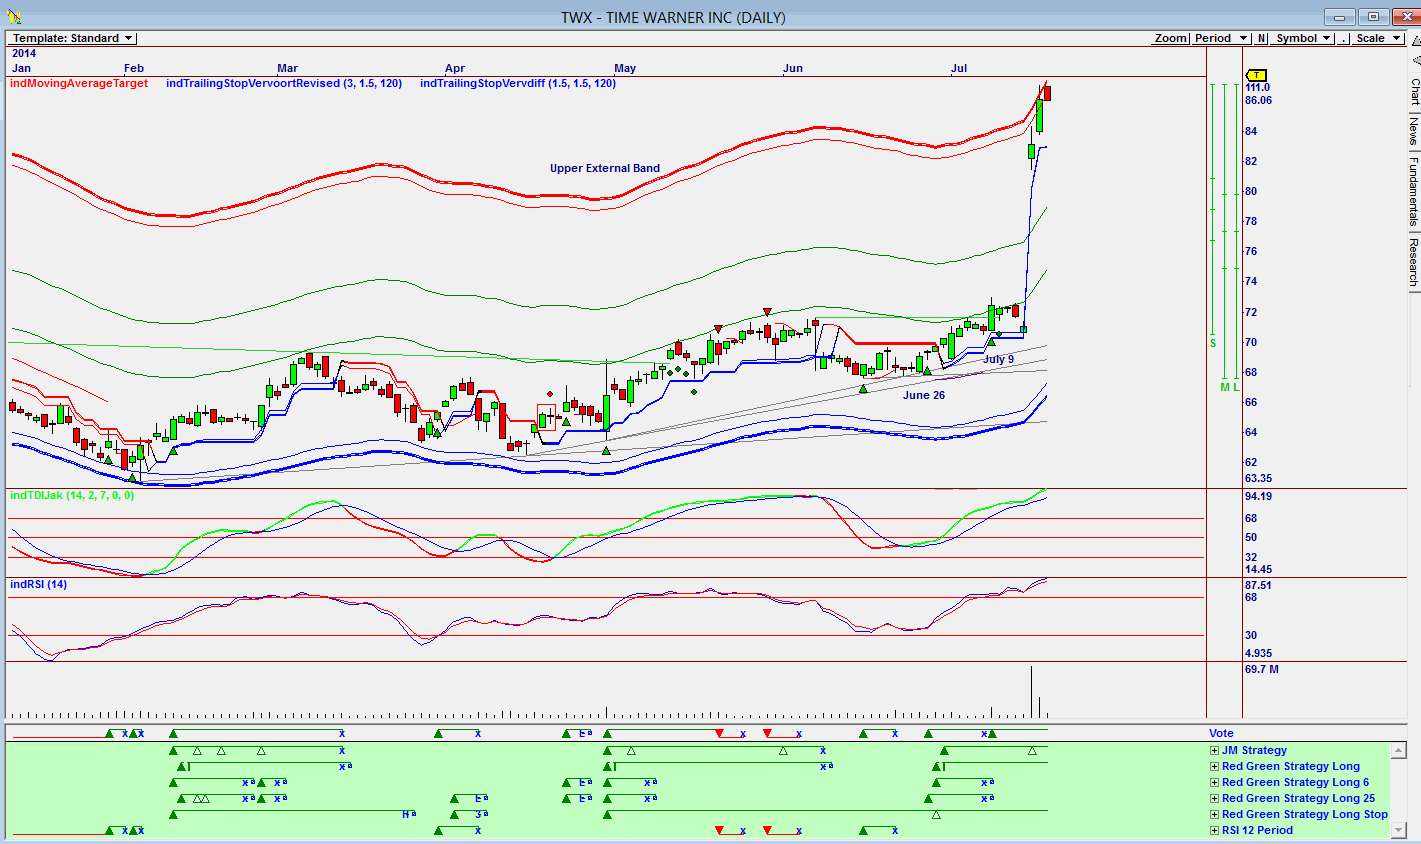
| Figure 3. Omnitrader chart showing buy signals given well before the takeover offer was made. |
| Graphic provided by: Omnitrader.. |
| |
| The chart in Figure 3 is an Omnitrader chart of TWX, which shows buy signals given on June 26, 2014 and July 9, 2014 based on the strategies shown in green below the Vote line. Although the Vote line has not suggested a sell signal, that the share price is flirting with the upper external band line suggests that the price could fall, probably to fill the gap. Note that both indicators on the chart have not given sell signals, but this could happen at any time. I would not be a buyer of TWX at the moment. I would prefer waiting to see if the share price would fall to fill the gap. However, Rupert Murdoch is not a person that gives in easily, so the chances that he would increase his offer is likely. I would, however, seriously consider buying the share on any correction or move made by FOXA. |
Has been a technical analyst since 1969, and has worked as a futures and options trader with First Financial Futures in Johannesburg, South Africa.
| Address: | 3256 West 24th Ave |
| Vancouver, BC | |
| Phone # for sales: | 6042634214 |
| E-mail address: | petroosp@gmail.com |
Click here for more information about our publications!
Comments

Request Information From Our Sponsors
- StockCharts.com, Inc.
- Candle Patterns
- Candlestick Charting Explained
- Intermarket Technical Analysis
- John Murphy on Chart Analysis
- John Murphy's Chart Pattern Recognition
- John Murphy's Market Message
- MurphyExplainsMarketAnalysis-Intermarket Analysis
- MurphyExplainsMarketAnalysis-Visual Analysis
- StockCharts.com
- Technical Analysis of the Financial Markets
- The Visual Investor
- VectorVest, Inc.
- Executive Premier Workshop
- One-Day Options Course
- OptionsPro
- Retirement Income Workshop
- Sure-Fire Trading Systems (VectorVest, Inc.)
- Trading as a Business Workshop
- VectorVest 7 EOD
- VectorVest 7 RealTime/IntraDay
- VectorVest AutoTester
- VectorVest Educational Services
- VectorVest OnLine
- VectorVest Options Analyzer
- VectorVest ProGraphics v6.0
- VectorVest ProTrader 7
- VectorVest RealTime Derby Tool
- VectorVest Simulator
- VectorVest Variator
- VectorVest Watchdog
