

HOT TOPICS LIST
- MACD
- Fibonacci
- RSI
- Gann
- ADXR
- Stochastics
- Volume
- Triangles
- Futures
- Cycles
- Volatility
- ZIGZAG
- MESA
- Retracement
- Aroon
INDICATORS LIST
LIST OF TOPICS
PRINT THIS ARTICLE
by Donald W. Pendergast, Jr.
Shares of Michael Kors Hldg. Ltd. (KORS) have staged a powerful bearish breakdown, one confirmed by multiple technical dynamics.
Position: N/A
Donald W. Pendergast, Jr.
Freelance financial markets writer and online publisher of the Trendzetterz.com S&P 500 Weekly Forecast service.
PRINT THIS ARTICLE
BREAKOUTS
Michael Kors: Major Breakdown?
07/21/14 01:04:10 PMby Donald W. Pendergast, Jr.
Shares of Michael Kors Hldg. Ltd. (KORS) have staged a powerful bearish breakdown, one confirmed by multiple technical dynamics.
Position: N/A
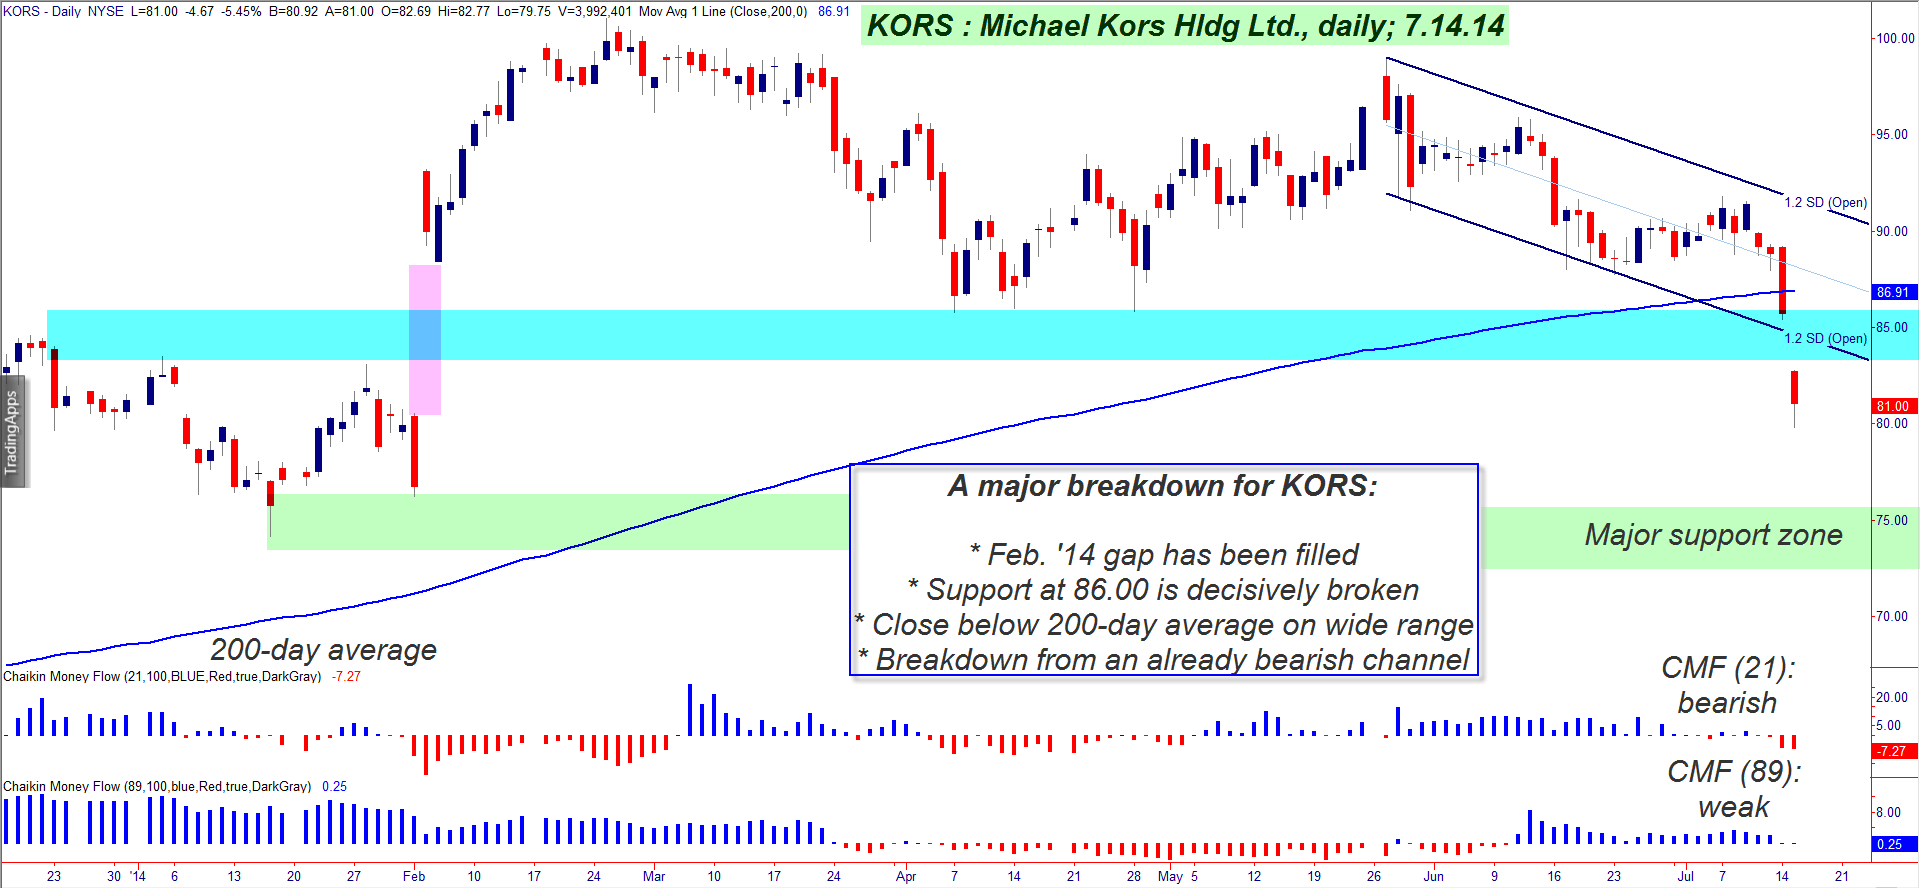
| Sometimes, a powerful, long-term uptrend ends not with a whimper but with a bang and in the case of Michael Kors Hldg. Ltd. (KORS), the bears are doing a 'bang-up job' as they sell the stock off at a ferocious rate. Here's a look at this major breakdown that may well lead to much deeper declines in the second half of 2014. |
|
| Figure 1. Michael Kors Hldg Ltd. (KORS): A weekly sell short signal will be confirmed if the close on Friday July 18, 2014 is below 84.88. The nominal profit target zone is near 66.50. |
| Graphic provided by: TradeStation. |
| |
| The more confirmation you have that a major trend reversal is underway, the more confidence you'll likely have to enter new positions in the direction of the new trend as they appear. In this example on the daily chart of KORS, we find at least four powerful confirmations (all occurring in rapid sequence) that this stock's most probable pathway is toward lower prices in the weeks and months ahead: 1. A wide-range bearish gap and close beneath the 200-day simple moving average (SMA). 2. A breakdown from the already bearish linear regression channel. 3. The significant support level at 86.00 (blue shaded area) is now history. 4. The bullish open gap from February 2014 has been filled. 5. On its weekly chart (not shown), KORS has clearly broken down out of a 30-month old linear regression channel of its own, setting the stage for deeper declines ahead. 6. The weekly chart also reveals that the "smart money" (institutional traders) have been distributing their shares in KORS since November 2013. As a whole, the six confirmations paint a convincing picture of a bull market reversing into either: * A significant, yet proportional correction of the gains seen since early 2012, or * The beginning of a major bear market in the stock. While no one knows which outcome will be finally seen, remember that what starts out as a high probability proportional correction (with the previous trend ultimately re-asserting itself afterward) can easily morph into an all-out bearish wipe-out. This is why it's so important to only trade what you see on your charts and to act on your proven trading strategy rather than on your natural trading biases — which are more often than not just plain wrong... and costly. |
|
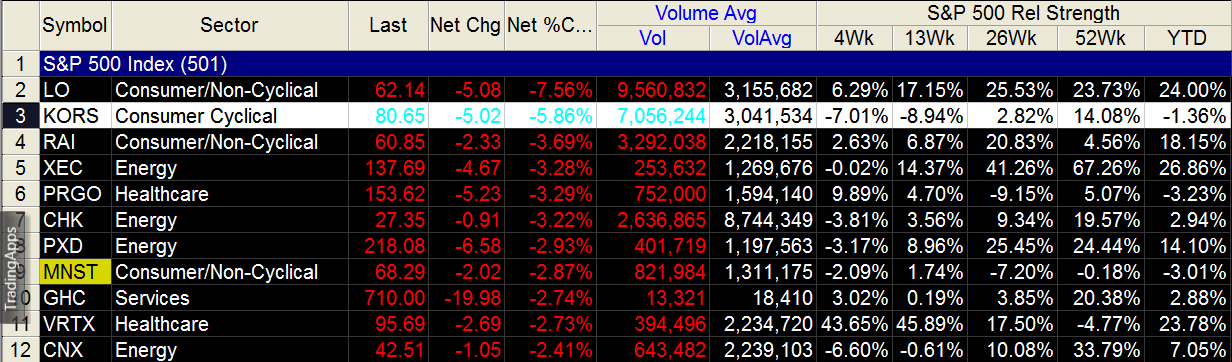
| Figure 2. KORS gets hammered along with many other large cap issues in the morning trading session on July 15, 2014. Energy and Consumer/Consumer Non-Cyclical sector stocks were hit the hardest. |
| Graphic provided by: TradeStation. |
| Graphic provided by: TradeStation RadarScreen. |
| |
| If you are currently looking for a long-term shorting opportunity, here's a dandy in KORS: A. With last Friday's close below 84.88, a long-term trend following short entry has be triggered. B. The initial stop will be 92.00 and the nominal price target for the move is toward the 66.50 area. C. Once short, you can manage the trade with a volatility trailing stop (three times the average true range of the prior ten weeks or 3 * ATR(10)), being sure to take at least partial profits should the stock descend toward the profit target prior to stopout. The entire US stock market is now vulnerable to a major correction (based on institutional distribution patterns in many large cap stocks) for the second half of 2014, so this short setup in KORS looks like it will be right in line with the 'get out of Dodge while you can' mindset of smart and savvy traders who see the warning signs ahead. As a trend following trade, perhaps 1-2% of account equity could be risked on this one; you may also consider playing this short setup with put options that have at least eight months of life before expiration. If you go this route, use puts that are in-the-money by at least 5%. Trade wisely until we meet here again. |
Freelance financial markets writer and online publisher of the Trendzetterz.com S&P 500 Weekly Forecast service.
| Title: | Market consultant and writer |
| Company: | Trendzetterz |
| Address: | 81 Hickory Hollow Drive |
| Crossville, TN 38555 | |
| Phone # for sales: | 904-303-4814 |
| Website: | trendzetterz.com |
| E-mail address: | support@trendzetterz.com |
Traders' Resource Links | |
| Trendzetterz has not added any product or service information to TRADERS' RESOURCE. | |
Click here for more information about our publications!
PRINT THIS ARTICLE

Request Information From Our Sponsors
- StockCharts.com, Inc.
- Candle Patterns
- Candlestick Charting Explained
- Intermarket Technical Analysis
- John Murphy on Chart Analysis
- John Murphy's Chart Pattern Recognition
- John Murphy's Market Message
- MurphyExplainsMarketAnalysis-Intermarket Analysis
- MurphyExplainsMarketAnalysis-Visual Analysis
- StockCharts.com
- Technical Analysis of the Financial Markets
- The Visual Investor
- VectorVest, Inc.
- Executive Premier Workshop
- One-Day Options Course
- OptionsPro
- Retirement Income Workshop
- Sure-Fire Trading Systems (VectorVest, Inc.)
- Trading as a Business Workshop
- VectorVest 7 EOD
- VectorVest 7 RealTime/IntraDay
- VectorVest AutoTester
- VectorVest Educational Services
- VectorVest OnLine
- VectorVest Options Analyzer
- VectorVest ProGraphics v6.0
- VectorVest ProTrader 7
- VectorVest RealTime Derby Tool
- VectorVest Simulator
- VectorVest Variator
- VectorVest Watchdog