

HOT TOPICS LIST
- MACD
- Fibonacci
- RSI
- Gann
- ADXR
- Stochastics
- Volume
- Triangles
- Futures
- Cycles
- Volatility
- ZIGZAG
- MESA
- Retracement
- Aroon
INDICATORS LIST
LIST OF TOPICS
PRINT THIS ARTICLE
by Donald W. Pendergast, Jr.
Up by more than 400% between September 2102 and June 2014, shares of Delta Airlines Inc. appear poised for a soft landing prior to another run higher.
Position: N/A
Donald W. Pendergast, Jr.
Freelance financial markets writer and online publisher of the Trendzetterz.com S&P 500 Weekly Forecast service.
PRINT THIS ARTICLE
TECHNICAL ANALYSIS
DAL: A Touch And Go - Higher?
07/17/14 04:06:33 PMby Donald W. Pendergast, Jr.
Up by more than 400% between September 2102 and June 2014, shares of Delta Airlines Inc. appear poised for a soft landing prior to another run higher.
Position: N/A
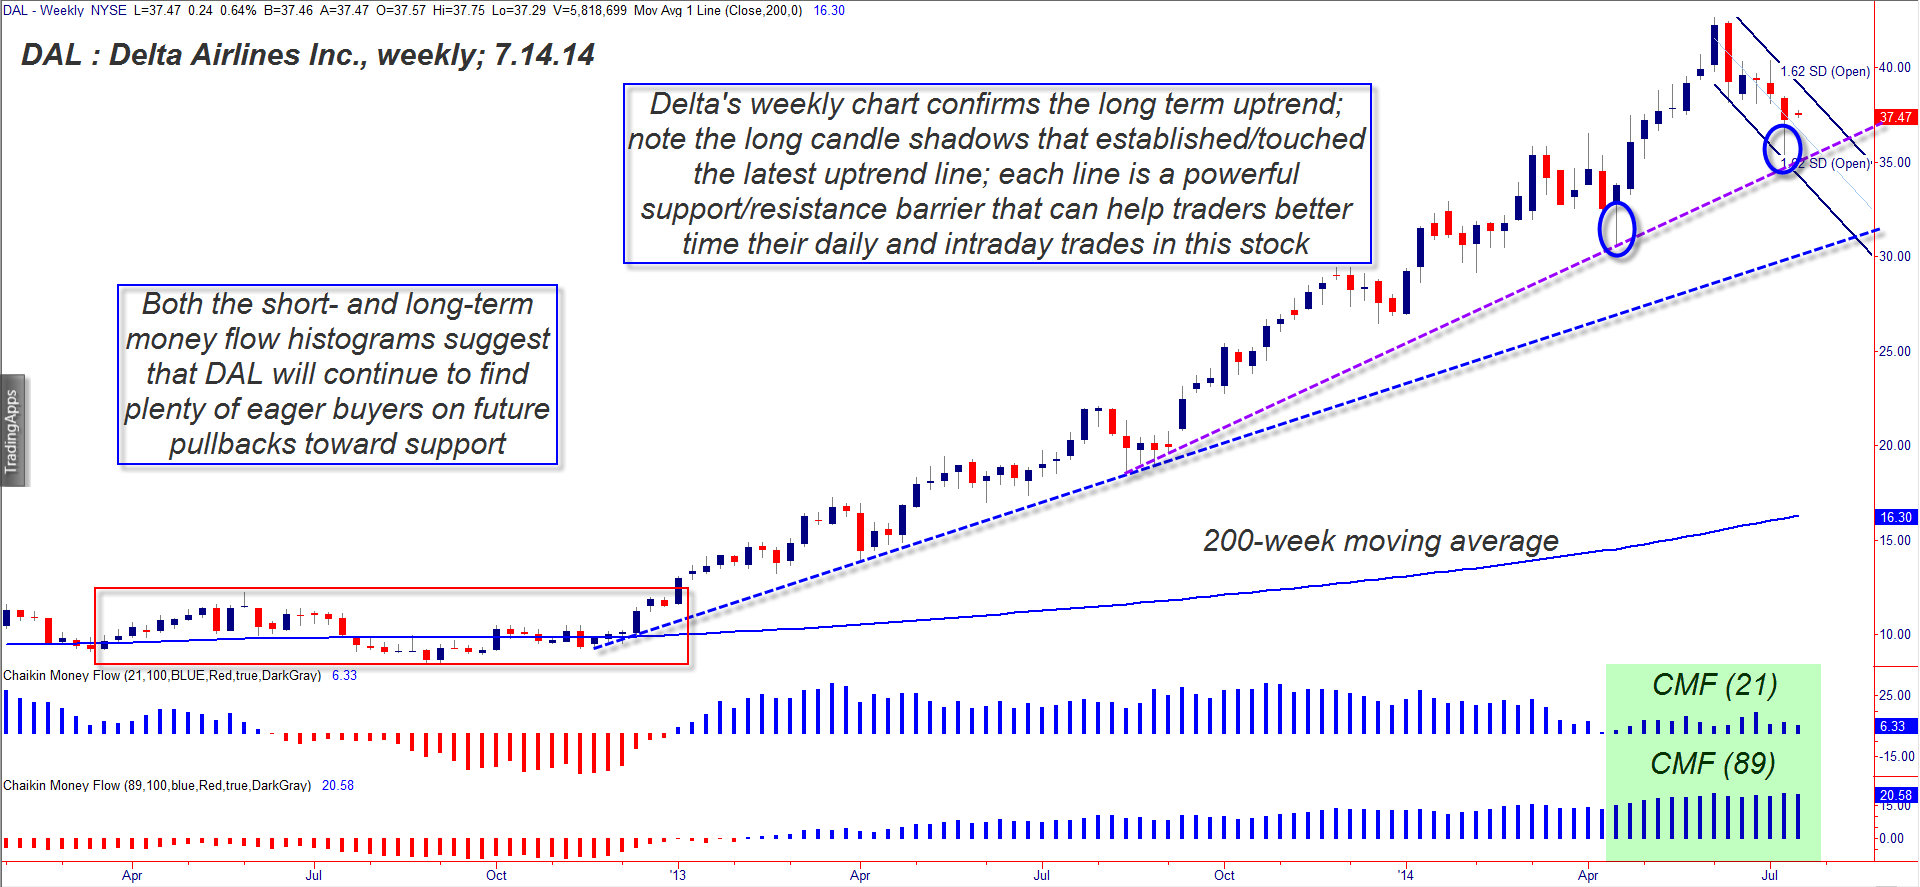
| A long-term bullish trend, such as the one we are about to examine in shares of Delta Airlines Inc. (DAL), offers many lessons to traders and investors with an open mind; we'll examine a few of the lessons that such trends can teach us and then examine where the line of least resistance lies with this soaring US airline issue. Here's a closer look now (Figure 1). |
|
| Figure 1. WILL IT MAKE ANOTHER RUN. With money flows remaining strong and strong trader/investor demand evident near the recent uptrend line, DAL may soon make another run higher toward its recent high of 42.66. |
| Graphic provided by: TradeStation. |
| |
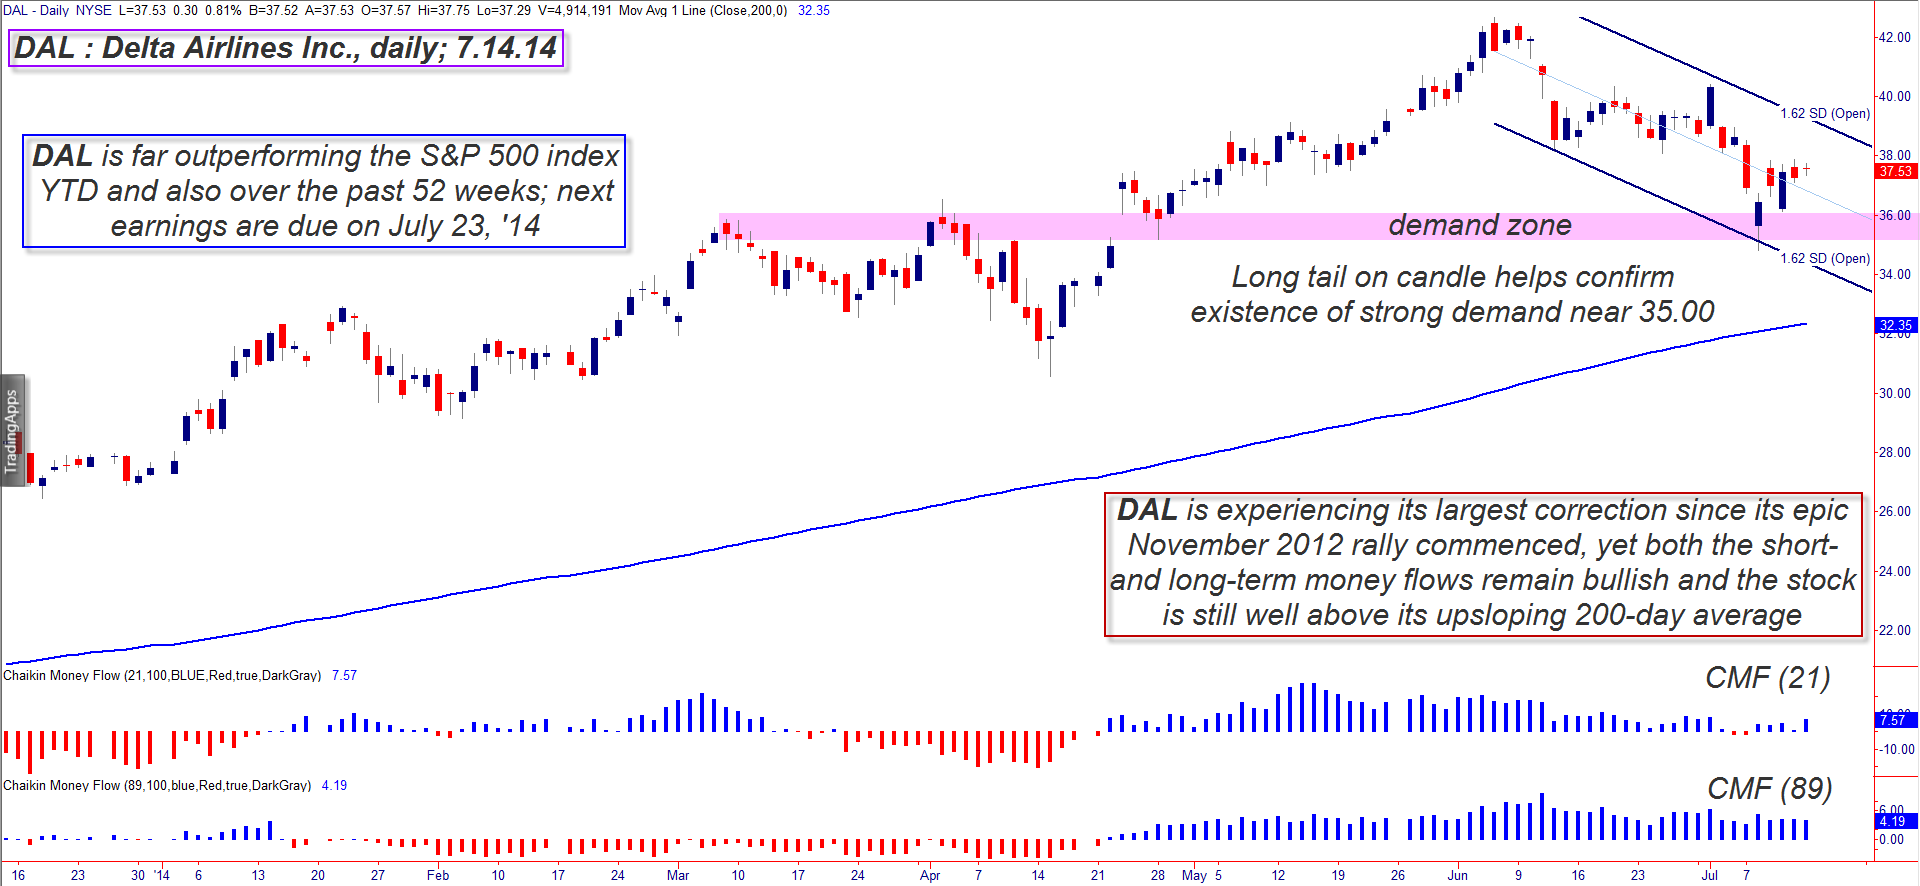
| First, the basic lessons that an ongoing, almost too good to be true major uptrend can teach us: 1. Never attempt to call a top in nor go short a powerfully up trending stock; wait until a confirmed bearish reversal in trend occurs first before considering the short side. 2. Be aware that stocks that are far outperforming the broad market indexes (S&P 500, Nasdaq 100, etc.) are inviting even greater institutional buying power to the party; learn to trade alongside these deep-pocketed, "smart money" investors rather than being so foolish as to attempt to fade them. 3. Pullbacks toward significant support levels (moving averages, trend lines, trailing stops, Fibonacci levels) when the short- and/or long-term money flow histograms remain above their zero lines are typically low-risk re-entry areas for new/add-on long positions. During the final third of this major uptrend, note how the newest trend line acted first as an anchor (thus confirming the new line) and then as a defacto support level on the latest — and deepest — pullback seen in the stock since mid-2012. The long shadows (wicks) on the weekly candles clearly reveal the strong demand from traders on each dip toward key support. The newest uptrend line also confirms the increasing bullish momentum, which is yet another incentive for savvy traders to jump onboard the stock. The short- and long-term Chaikin Money Flow histograms [CMF(21 and 89)] remained bullish on each weekly pullback and that the longer term one is near its all-time high, despite such a proportional (normal) correction after such a terrific run higher. Moving to the daily chart (Figure 2), the money flow histograms also remain bullish despite the month-long correction in DAL, with the stock still trading well above its rising 200-day simple moving average (SMA). The stock remains within a bearish linear regression channel, but once a daily close above the topline can be achieved, the "all clear" buy signal will be plain to see for those who understand all of the dynamics previously mentioned. DAL is far outperforming the .SPX (S&P 500 index) over the past 26- and 52-week periods and is also excelling year-to-date. |
|
| Figure 2. STILL BULLISH. DAL's daily chart gives a better look at the strong demand zone near the 35.00 price level. Money flows are bullish on this trading time frame as well. |
| Graphic provided by: TradeStation. |
| |
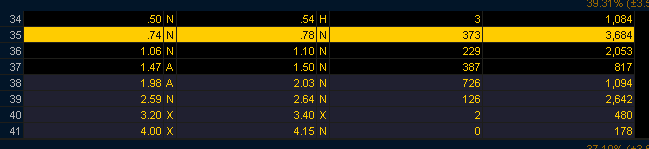
| A simple way for skilled option traders to get in on a potential bullish breakout for DAL might look like this: 1. Wait for a daily close above the channel topline (currently near 39.05) and then sell the August '14 DAL $35 put option (see Figure 3). The bid/ask spread is good and open interest/daily trading volume is also good for this put, something you always need to have in your favor when selling puts &mdahs; or calls. 2. Since DAL has a good shot at testing the recent high of 42.65, that will be your initial price target for the stock; however, if your put declines in value by 60% or more, consider taking your profits a bit early, just to be safe. 3. If the put increases in value by 80-85%, buy it back at a loss right away; a close back inside the channel might also make a good case for closing out the trade. Keep your account risk at 1% maximum for this trade and always pay extra attention to any net short positions you have in the market. Trade wisely until we meet here again. |
|
| Figure 3. WHAT ARE YOUR OPTIONS? The August '14 DAL $35.00 put option has a modest bid/ask spread along with healthy daily trading volume and open interest. |
| Graphic provided by: TD Ameritrade/ThinkorSwim. |
| |
Freelance financial markets writer and online publisher of the Trendzetterz.com S&P 500 Weekly Forecast service.
| Title: | Market consultant and writer |
| Company: | Trendzetterz |
| Address: | 81 Hickory Hollow Drive |
| Crossville, TN 38555 | |
| Phone # for sales: | 904-303-4814 |
| Website: | trendzetterz.com |
| E-mail address: | support@trendzetterz.com |
Traders' Resource Links | |
| Trendzetterz has not added any product or service information to TRADERS' RESOURCE. | |
Click here for more information about our publications!
Comments
Date:�07/20/14Rank:�5Comment:�

Request Information From Our Sponsors
- StockCharts.com, Inc.
- Candle Patterns
- Candlestick Charting Explained
- Intermarket Technical Analysis
- John Murphy on Chart Analysis
- John Murphy's Chart Pattern Recognition
- John Murphy's Market Message
- MurphyExplainsMarketAnalysis-Intermarket Analysis
- MurphyExplainsMarketAnalysis-Visual Analysis
- StockCharts.com
- Technical Analysis of the Financial Markets
- The Visual Investor
- VectorVest, Inc.
- Executive Premier Workshop
- One-Day Options Course
- OptionsPro
- Retirement Income Workshop
- Sure-Fire Trading Systems (VectorVest, Inc.)
- Trading as a Business Workshop
- VectorVest 7 EOD
- VectorVest 7 RealTime/IntraDay
- VectorVest AutoTester
- VectorVest Educational Services
- VectorVest OnLine
- VectorVest Options Analyzer
- VectorVest ProGraphics v6.0
- VectorVest ProTrader 7
- VectorVest RealTime Derby Tool
- VectorVest Simulator
- VectorVest Variator
- VectorVest Watchdog