HOT TOPICS LIST
- MACD
- Fibonacci
- RSI
- Gann
- ADXR
- Stochastics
- Volume
- Triangles
- Futures
- Cycles
- Volatility
- ZIGZAG
- MESA
- Retracement
- Aroon
INDICATORS LIST
LIST OF TOPICS
PRINT THIS ARTICLE
by Koos van der Merwe
On July 11, 2014 Micron Technologies (MU) announced the introduction of a new component.
Position: Buy
Koos van der Merwe
Has been a technical analyst since 1969, and has worked as a futures and options trader with First Financial Futures in Johannesburg, South Africa.
PRINT THIS ARTICLE
ELLIOTT WAVE
A Buy For Micron Technologies
07/21/14 12:50:33 PMby Koos van der Merwe
On July 11, 2014 Micron Technologies (MU) announced the introduction of a new component.
Position: Buy
| Micron Technology, Inc. (MU) is a global leader in advanced semiconductor systems. Micron's broad portfolio of high-performance memory technologies is the basis for solid state drives, modules, multichip packages, and other system solutions. Micron's memory solutions enable the world's most innovative computing. When it made an announcement on July 11, 2014 that it has introduced a new product that will expand the memory footprint to meet the high performance needs of hyperscale data centers, the news was welcomed. |

|
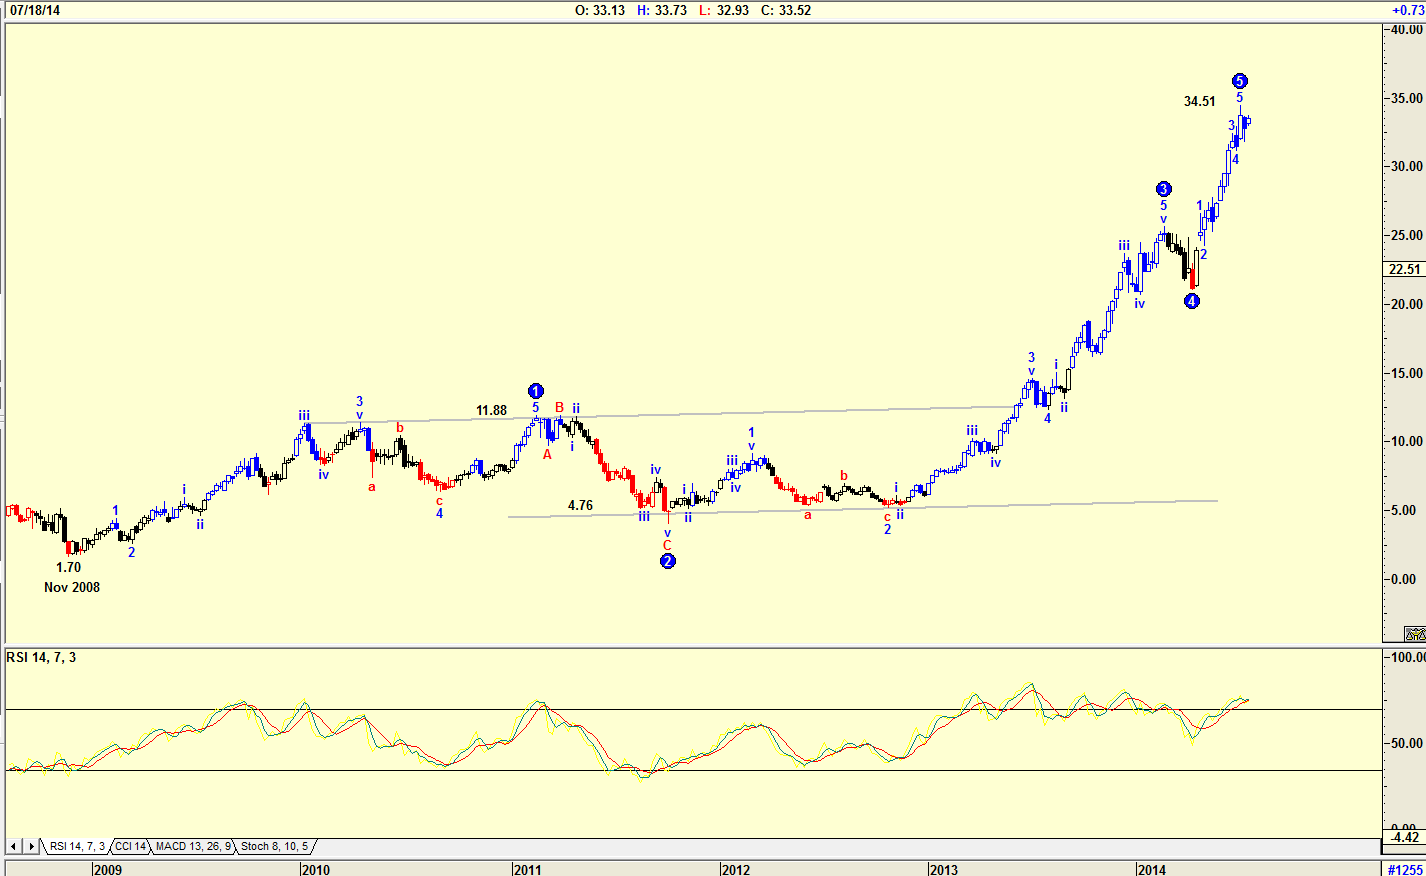
| Figure 1. Weekly chart with Elliott Wave count. |
| Graphic provided by: AdvancedGET. |
| |
| The chart in Figure 1 is a weekly chart with an Elliott Wave count suggesting that the share price is topping out in a WAVE 5. This is confirmed by the relative strength index (RSI) which is at overbought levels. The chart suggests that any rise suggested could be short lived. |

|
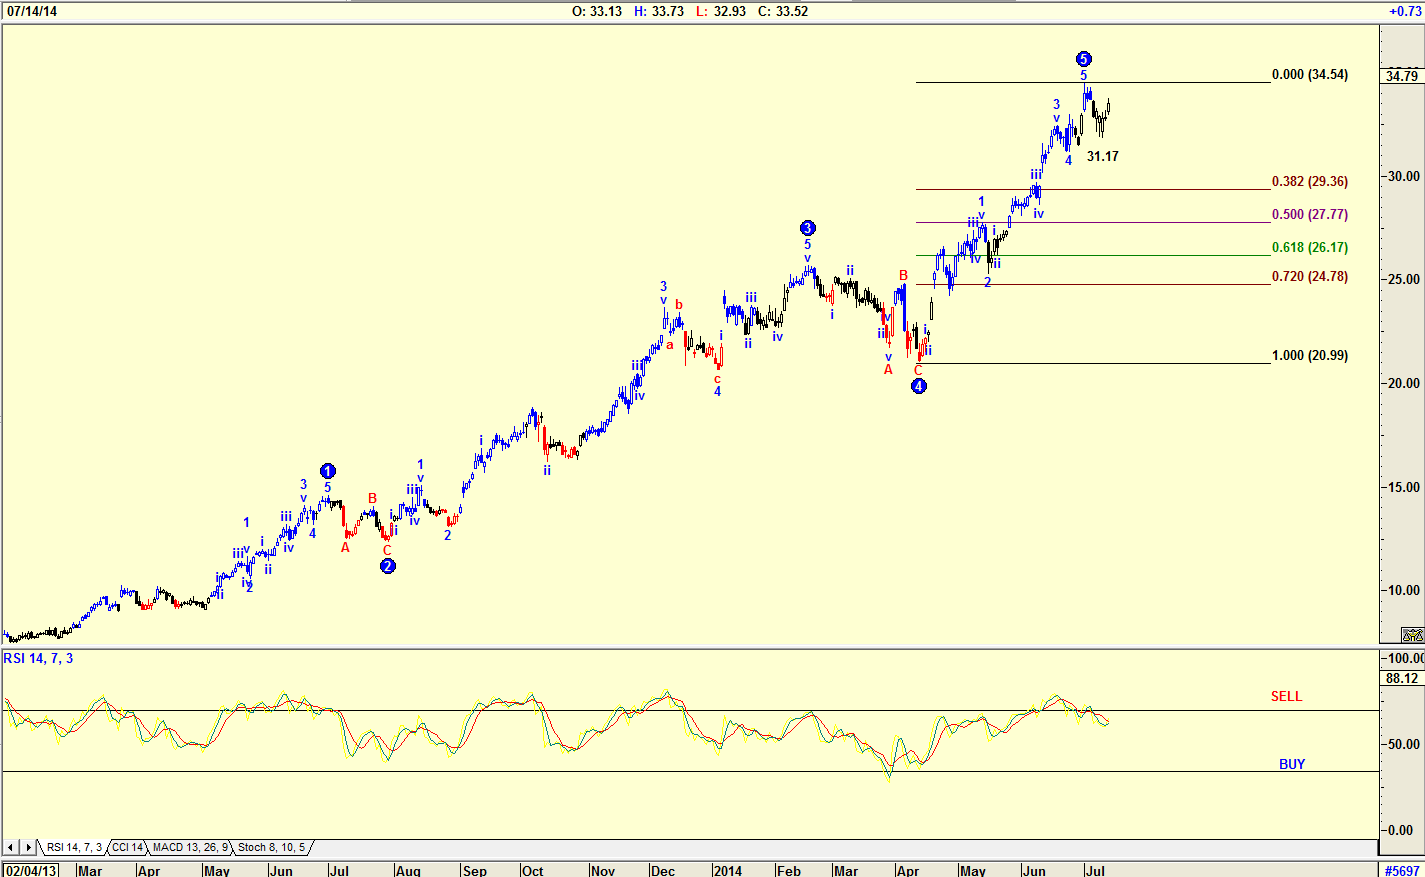
| Figure 2. Daily chart with Elliott Wave count and Fibonacci retracement levels. |
| Graphic provided by: AdvancedGET. |
| |
| The daily chart (Figure 2) of the Advanced GET program confirms the Elliott Wave count of the weekly chart, suggesting a WAVE 5 top has formed. A Fibonacci retracement suggests that the share price could fall to $29.36 (38.2%), $27.77 (50%) or $26.17(61.8%). The Elliott Wave rule suggests that a Wave 5 correction should fall to the 4th wave of lesser degree. This suggests that the correction need only be to $31.17. With the RSI only just showing a sell signal, the correction could be to one of the Fibonacci levels. |

|
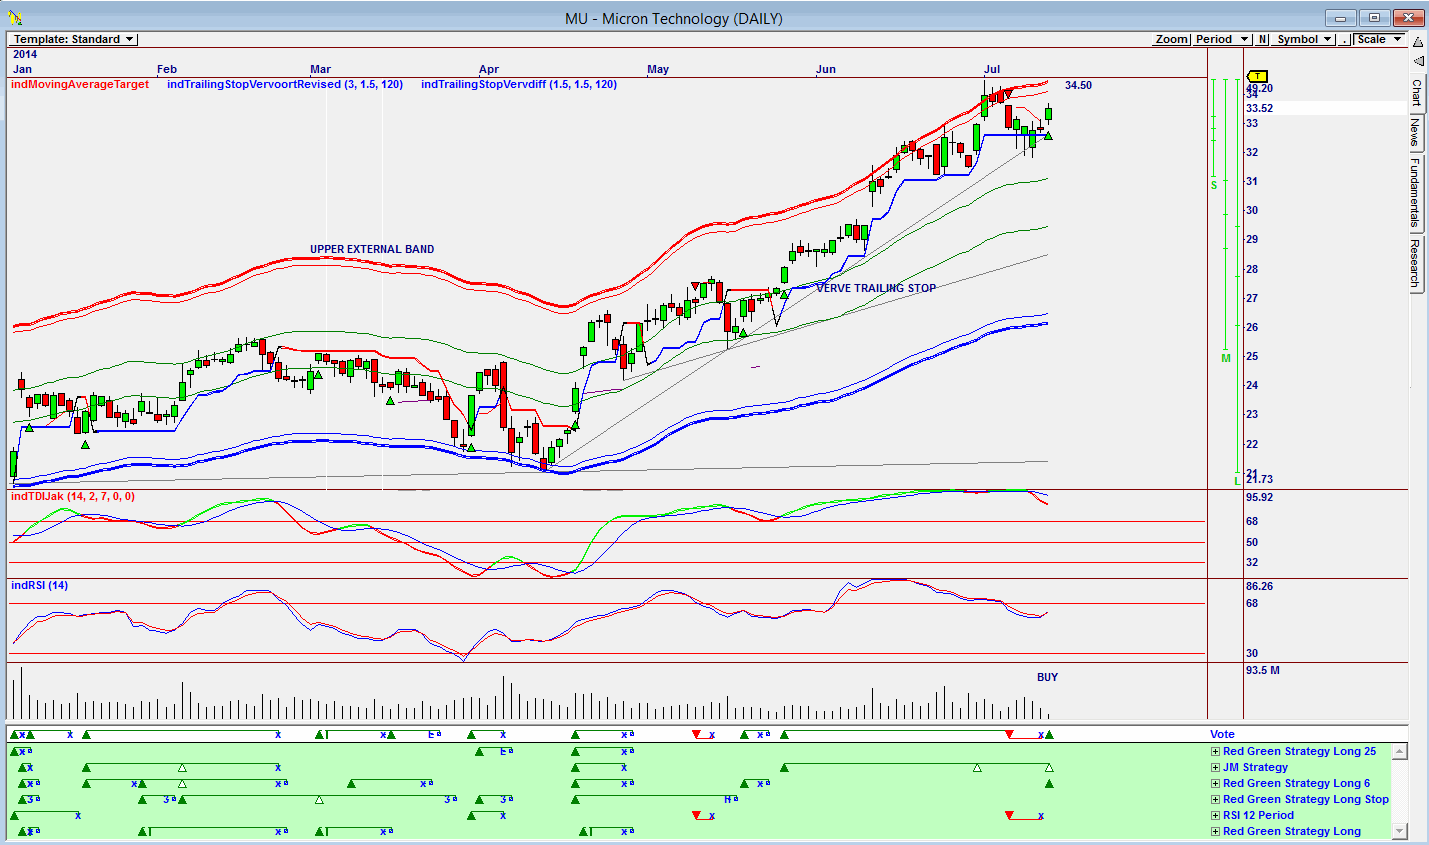
| Figure 3. Daily Omnitrader chart showing Vote line buy signal. |
| Graphic provided by: Omnitrader. |
| |
| The chart in Figure 3 is an Omnitrader chart that brought the share to my attention. The vote line triggered a buy signal based on the JM Strategy and the Red Green Strategy Long 6 both shown in green below the vote line. The target for the rise in the share price is the upper band at $34.50. With the buy price at $33.52, this gives a profit of $1.00, (2.9%). Note that the RSI on the chart has suggested a buy while the TDIJak indicator has not. Also note that the RSI 12 period strategy shown in green below the vote line has stopped out its sell. |

|
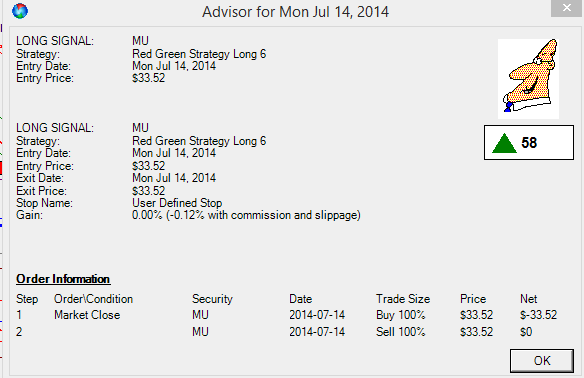
| Figure 4. Advisor rating suggesting a buy. |
| Graphic provided by: Omnitrader. |
| |
| Finally, note the Advisor rating shown in Figure 4. The rating is 58, not as strong as I would prefer, but nevertheless a buy signal. The exit date and exit price shown will move with the price, suggesting an exit point. I would be a buyer of Micron Technology (MU) at $32.52 but would keep my stops close. |
Has been a technical analyst since 1969, and has worked as a futures and options trader with First Financial Futures in Johannesburg, South Africa.
| Address: | 3256 West 24th Ave |
| Vancouver, BC | |
| Phone # for sales: | 6042634214 |
| E-mail address: | petroosp@gmail.com |
Click here for more information about our publications!
PRINT THIS ARTICLE

|

Request Information From Our Sponsors
- StockCharts.com, Inc.
- Candle Patterns
- Candlestick Charting Explained
- Intermarket Technical Analysis
- John Murphy on Chart Analysis
- John Murphy's Chart Pattern Recognition
- John Murphy's Market Message
- MurphyExplainsMarketAnalysis-Intermarket Analysis
- MurphyExplainsMarketAnalysis-Visual Analysis
- StockCharts.com
- Technical Analysis of the Financial Markets
- The Visual Investor
- VectorVest, Inc.
- Executive Premier Workshop
- One-Day Options Course
- OptionsPro
- Retirement Income Workshop
- Sure-Fire Trading Systems (VectorVest, Inc.)
- Trading as a Business Workshop
- VectorVest 7 EOD
- VectorVest 7 RealTime/IntraDay
- VectorVest AutoTester
- VectorVest Educational Services
- VectorVest OnLine
- VectorVest Options Analyzer
- VectorVest ProGraphics v6.0
- VectorVest ProTrader 7
- VectorVest RealTime Derby Tool
- VectorVest Simulator
- VectorVest Variator
- VectorVest Watchdog
