HOT TOPICS LIST
- MACD
- Fibonacci
- RSI
- Gann
- ADXR
- Stochastics
- Volume
- Triangles
- Futures
- Cycles
- Volatility
- ZIGZAG
- MESA
- Retracement
- Aroon
INDICATORS LIST
LIST OF TOPICS
PRINT THIS ARTICLE
by Chaitali Mohile
Ecolab (ECL) is forming a consolidation pattern. Is the stock ready for a breakout?
Position: N/A
Chaitali Mohile
Active trader in the Indian stock markets since 2003 and a full-time writer. Trading is largely based upon technical analysis.
PRINT THIS ARTICLE
BREAKOUTS
Ecolab Waiting For Breakout
07/17/14 03:57:49 PMby Chaitali Mohile
Ecolab (ECL) is forming a consolidation pattern. Is the stock ready for a breakout?
Position: N/A
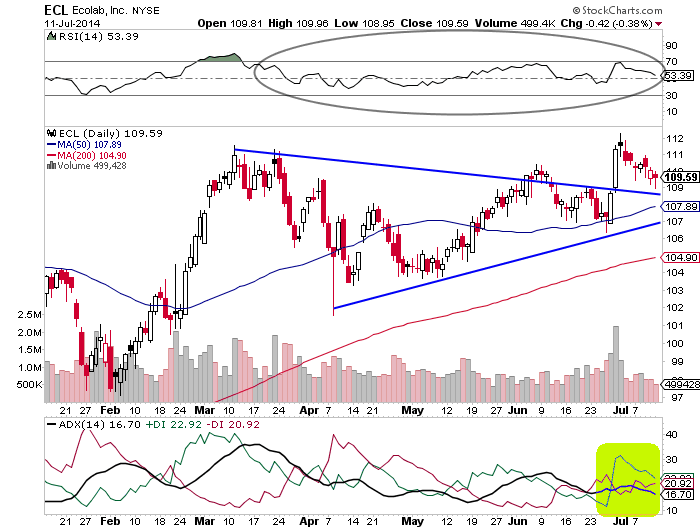
| Ecolab (ECL) is a strong stock that has offered healthy profits in the last few years. But in early 2014, the steady vertical rally of ECL reversed. A large symmetrical triangle formed in Figure 1. The two converging trendlines of the triangle show the high volatility that took place during the narrow trading range. A potential breakout direction of the symmetrical triangle cannot be anticipated. ECL has been moving within this converging formation for two to three months. The stock witnessed an unstable trend and weak bullish force; as a result, the price rally formed a series of lower highs and higher lows. |
| The relative strength index (RSI)(14) in Figure 1 ranged between 50 and 70 levels. The RSI was unable to sustain in the bullish area above 50 levels, indicating volatility and an unstable breakout rally. The average directional index (ADX)(14) has slipped below 18 levels, suggesting consolidation for ECL. Therefore, the recent upward breakout of the symmetrical triangle is likely to face uncertainty. Eventually, the stock will retrace toward the converging trendlines of the triangle. Hence it is difficult to understand the breakout direction of symmetrical triangles until it actually breaks. |

|
| Figure 1. SYMMETRICAL TRIANGLE. Notice how the series of lower highs and higher lows within the blue trendlines resemble a symmetrical triangle. |
| Graphic provided by: StockCharts.com. |
| |
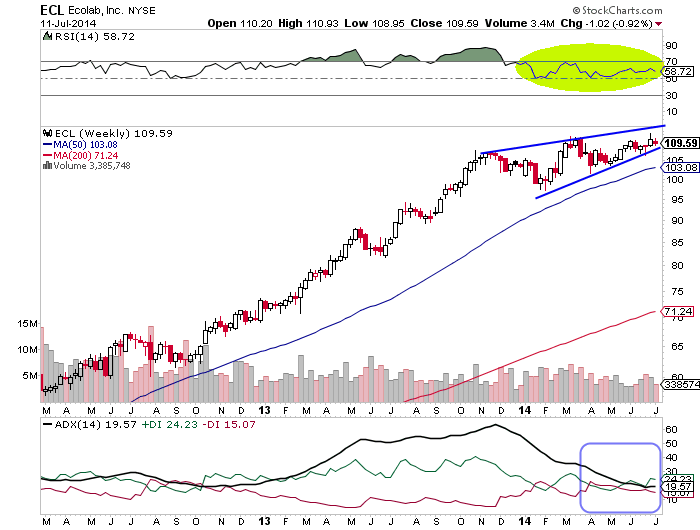
| This triangular pattern can be considered a consolidation pattern if it appears after an upward rally. In Figure 2, the symmetrical formation is a bullish flag & pennant continuation pattern. The long-term bullish rally reversed due to an overheated uptrend and an overbought RSI(14). Later, the stock moved in a sideways consolidation, forming the flag & pennant on the weekly chart. The RSI(14) is steadily moving into the bullish area between 50 and 70. The descending trend indicator, the tangled positive directional index (+DI), and the negative directional index (-DI) are suggesting that the stock is likely to consolidate for the next few weeks. However, the stock should maintain its bullishness throughout the consolidation period. |

|
| Figure 2. A LIKELY CONSOLIDATION. On the weekly chart of ECL, a flag & pennant formation looks to have formed, the RSI (14) is moving into a bullish area, the trend indicator, and positive/negative directional index are suggesting a likely consolidation for a few more weeks. |
| Graphic provided by: StockCharts.com. |
| |
| Once the bullish continuation pattern gets matured, ECL would breakout in an upward direction. Thereafter, the stock would resume its previous advance rally. Although the minimum estimated target of the bullish flag & pennant pattern is calculated by adding the length of the flag pole to the breakout point, you would not follow the same rule here. Traders and investors can have a small medium-term target with low risk. If you trade considering the target measured by the technical rule mentioned earlier, there will be high risk involved for a longer time frame. |
| To conclude, the bullish breakout of ECL would occur after a few weeks. Traders should wait for the confirmed buy signal from the RSI(14). |
Active trader in the Indian stock markets since 2003 and a full-time writer. Trading is largely based upon technical analysis.
| Company: | Independent |
| Address: | C1/3 Parth Indraprasth Towers. Vastrapur |
| Ahmedabad, Guj 380015 | |
| E-mail address: | chaitalimohile@yahoo.co.in |
Traders' Resource Links | |
| Independent has not added any product or service information to TRADERS' RESOURCE. | |
Click here for more information about our publications!
PRINT THIS ARTICLE

Request Information From Our Sponsors
- StockCharts.com, Inc.
- Candle Patterns
- Candlestick Charting Explained
- Intermarket Technical Analysis
- John Murphy on Chart Analysis
- John Murphy's Chart Pattern Recognition
- John Murphy's Market Message
- MurphyExplainsMarketAnalysis-Intermarket Analysis
- MurphyExplainsMarketAnalysis-Visual Analysis
- StockCharts.com
- Technical Analysis of the Financial Markets
- The Visual Investor
- VectorVest, Inc.
- Executive Premier Workshop
- One-Day Options Course
- OptionsPro
- Retirement Income Workshop
- Sure-Fire Trading Systems (VectorVest, Inc.)
- Trading as a Business Workshop
- VectorVest 7 EOD
- VectorVest 7 RealTime/IntraDay
- VectorVest AutoTester
- VectorVest Educational Services
- VectorVest OnLine
- VectorVest Options Analyzer
- VectorVest ProGraphics v6.0
- VectorVest ProTrader 7
- VectorVest RealTime Derby Tool
- VectorVest Simulator
- VectorVest Variator
- VectorVest Watchdog
