HOT TOPICS LIST
- MACD
- Fibonacci
- RSI
- Gann
- ADXR
- Stochastics
- Volume
- Triangles
- Futures
- Cycles
- Volatility
- ZIGZAG
- MESA
- Retracement
- Aroon
INDICATORS LIST
LIST OF TOPICS
PRINT THIS ARTICLE
by Gary Grosschadl
Positive action in the main indices has brought the golds understandably down and gold traders are in a quandry as to their next move.
Position: N/A
Gary Grosschadl
Independent Canadian equities trader and technical analyst based in Peterborough
Ontario, Canada.
PRINT THIS ARTICLE
CHART ANALYSIS
Gold Index Showing Mixed Signals
10/18/02 08:33:50 AMby Gary Grosschadl
Positive action in the main indices has brought the golds understandably down and gold traders are in a quandry as to their next move.
Position: N/A
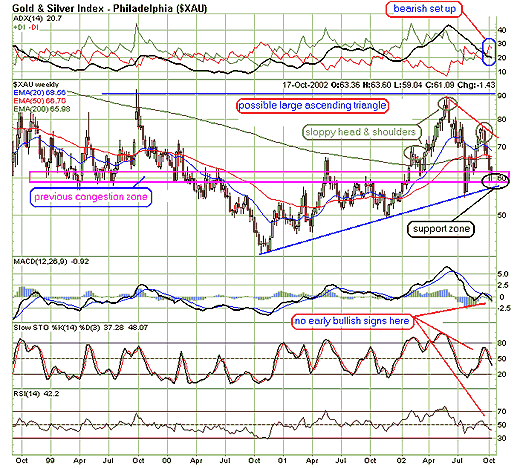
| Looking at the 4-year weekly chart I can decipher several important areas. First, this view shows a possible bullish ascending triangle - that is if the lower trendline holds. This implies a possible move back up to previous highs and possibly a triple top (if the advance is halted by the top line). This would fit a wildcard type of scenario (such as a mideast war...further terrorism...or the Dow crashing to new lows). Looking at the proposed support zone (58-60), and taking in the combination of the lower trendline and previous congestion zone, this would be a likely place for the gold index to dig in its heels and try to base before a new upleg. |
| But on the other hand the bearish view also has its proponents. A move below this lower trendline would be a blow to any bulls. I could also argue there is a rather sloppy head and shoulders formation (not the best symmetry for neckline) which could be a harbinger for a further breakdown. |

|
| Graphic provided by: stockcharts.com. |
| |
| Although in the very short-term, recent candlesticks hint at a possible combination tweezer/hammer bottom which has bullish potential, the displayed indicators are still bearish looking and need to turn around. |
| Should the index make an upleg, there will be several resistance lines that could make this a brief run making it hard for traders to profit unless they are very nimble. Watch out for possible reversals between 66 and 69 where there are three moving average lines and the trendline around 72. The downside watch will be for a sustained move below the lower trendline around the 58 level. So the gold markets remain as they have been - tricky to play and reversal oriented. Keep this in mind when trading this challenging commodity. |
Independent Canadian equities trader and technical analyst based in Peterborough
Ontario, Canada.
| Website: | www.whatsonsale.ca/financial.html |
| E-mail address: | gwg7@sympatico.ca |
Click here for more information about our publications!
PRINT THIS ARTICLE

Request Information From Our Sponsors
- StockCharts.com, Inc.
- Candle Patterns
- Candlestick Charting Explained
- Intermarket Technical Analysis
- John Murphy on Chart Analysis
- John Murphy's Chart Pattern Recognition
- John Murphy's Market Message
- MurphyExplainsMarketAnalysis-Intermarket Analysis
- MurphyExplainsMarketAnalysis-Visual Analysis
- StockCharts.com
- Technical Analysis of the Financial Markets
- The Visual Investor
- VectorVest, Inc.
- Executive Premier Workshop
- One-Day Options Course
- OptionsPro
- Retirement Income Workshop
- Sure-Fire Trading Systems (VectorVest, Inc.)
- Trading as a Business Workshop
- VectorVest 7 EOD
- VectorVest 7 RealTime/IntraDay
- VectorVest AutoTester
- VectorVest Educational Services
- VectorVest OnLine
- VectorVest Options Analyzer
- VectorVest ProGraphics v6.0
- VectorVest ProTrader 7
- VectorVest RealTime Derby Tool
- VectorVest Simulator
- VectorVest Variator
- VectorVest Watchdog
