

HOT TOPICS LIST
- MACD
- Fibonacci
- RSI
- Gann
- ADXR
- Stochastics
- Volume
- Triangles
- Futures
- Cycles
- Volatility
- ZIGZAG
- MESA
- Retracement
- Aroon
INDICATORS LIST
LIST OF TOPICS
PRINT THIS ARTICLE
by Donald W. Pendergast, Jr.
After rising out of a double bottom pattern in late June 2014, shares of Noble Corp. now appear to be setting up for another rally.
Position: N/A
Donald W. Pendergast, Jr.
Freelance financial markets writer and online publisher of the Trendzetterz.com S&P 500 Weekly Forecast service.
PRINT THIS ARTICLE
TECHNICAL ANALYSIS
NE: Proportional Pullback In Rising Trend
07/15/14 04:40:32 PMby Donald W. Pendergast, Jr.
After rising out of a double bottom pattern in late June 2014, shares of Noble Corp. now appear to be setting up for another rally.
Position: N/A
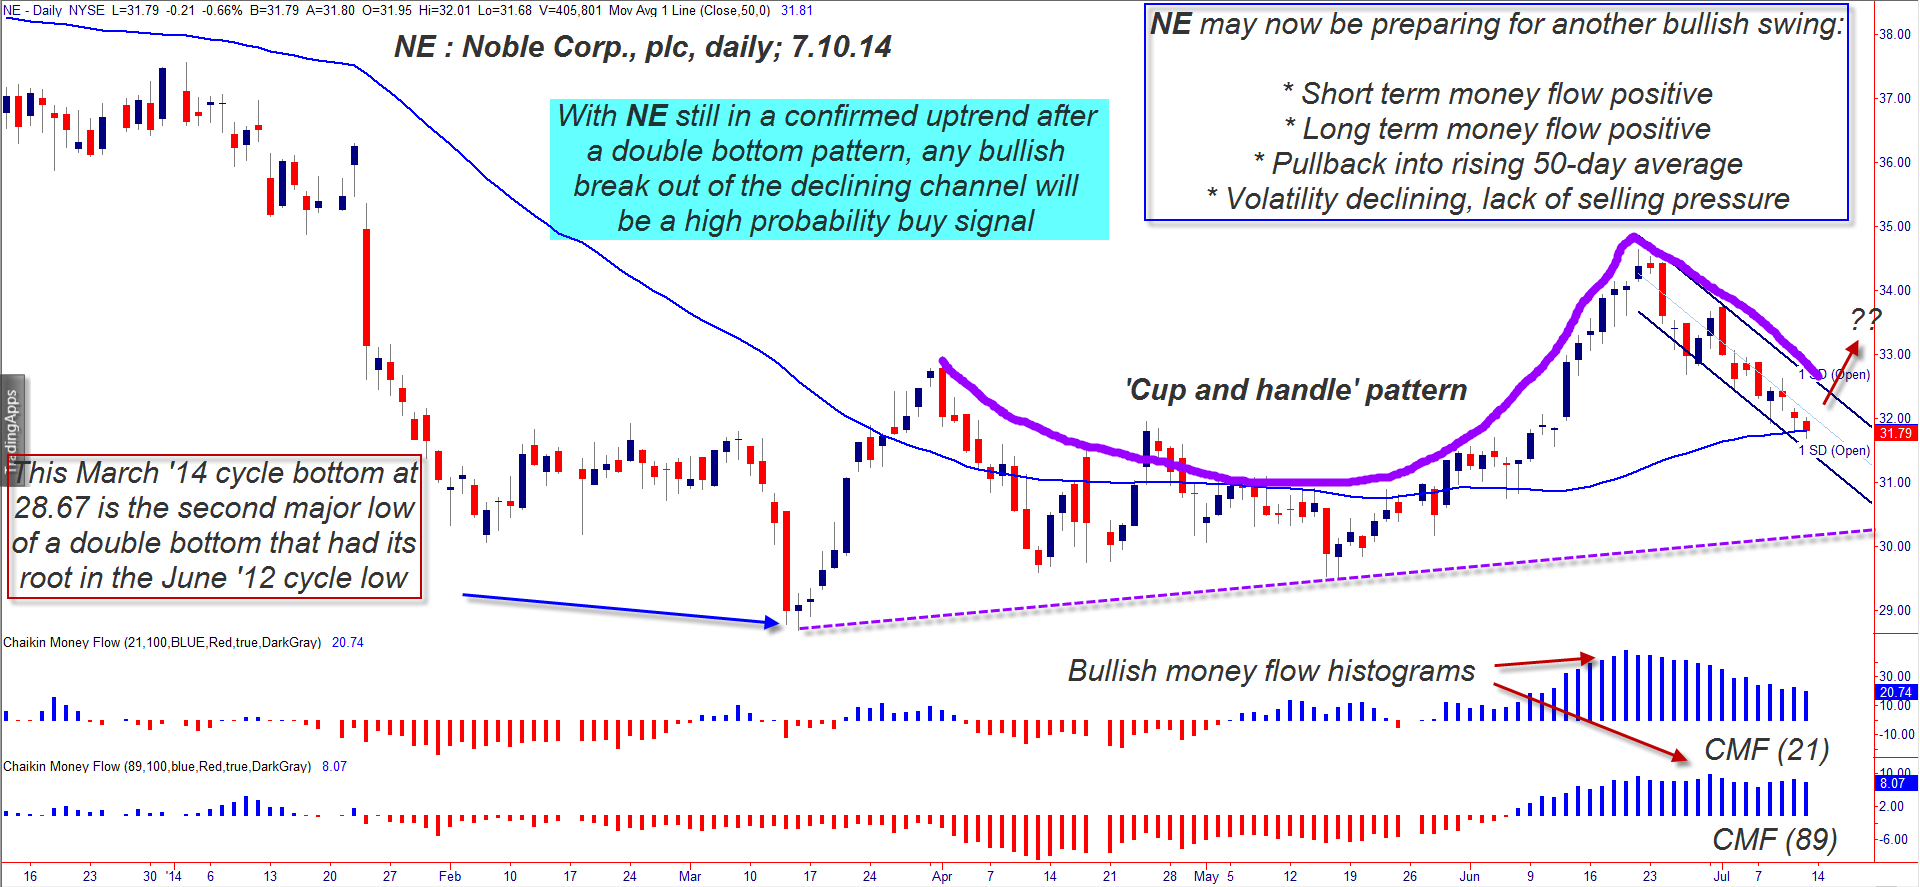
| Shares of Noble Corp. (NE) had a rough go of it from November 2013-March 2014, sliding by nearly 30% in a persistent downtrend. But in the wake of the significant, completed double bottom pattern from June 25, 2014 onward, the stock has been given a new lease on life and may be soon heading even higher. Here's a closer look at NE's daily chart (Figure 1). |
|
| Figure 1. Noble Corp. plc (NE) has traced out a lovely cup & handle pattern on its daily and weekly charts; a break and close above the top line of the linear regression channel should help ignite a swift run up toward the 33.90 area. |
| Graphic provided by: TradeStation. |
| |
| NE's downward move from late 2013 into early 2014 was a trend follower's dream; there were few pullbacks once the stock gained sufficient downward momentum and traders who got short early on were well-rewarded. But the end of the bearish move on March 14, 2014 also coincided with the major support established by a previous major low on June 25, 2012, at the 28.67 level. Once that double bottom proved to be legit — as evidenced by the gradual recovery in the stock over the past four months — traders and institutional investors began to take a keen interest in getting positioned in NE. Here are the most compelling details to be aware of in this stock right now: 1. The 21-day Chaikin Money Flow (CMF)(21) histogram has remained bullish during the latest pullback to support. 2. The same can also be said for the 89-day CMF histogram. 3. Volatility has diminished as the stock now tests its upwardly sloping 50-day simple moving average (SMA). 4. A beautiful cup & handle pattern has manifested on the daily/weekly charts for NE; given that the general uptrend of the stock is still in force, this looks to be a precursor to a high-probability upside breakout in the sessions just ahead. The bright blue money flow histograms confirm that the "smart money" players in the market are fully committed to their existing long positions in this stock and that a low risk buy zone is now appearing as the pullback goes into a major area of chart support. |
|
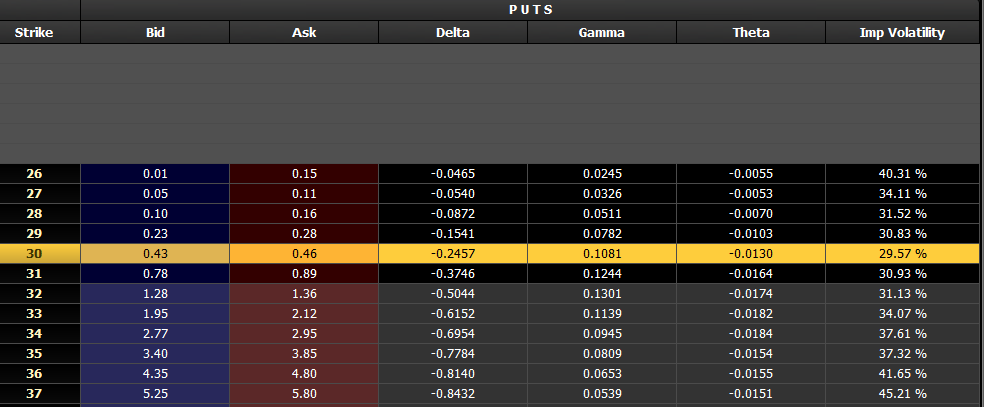
| Figure 2. NE's August '14 $30.00 put option has a decent bid/ask spread and also has good liquidity and daily time decay factor. |
| Graphic provided by: TradeStation. |
| Graphic provided by: OptionStation Pro. |
| |
| For experienced put sellers, this looks like an attractive premium selling opportunity, especially when using near-term expiry options: 1. Sell the Aug 2014 $30.00 put on a break above the linear regression channel (top line currently near 32.80 and falling). 2. Hold the put for a potential rally up toward the 200-day average, currently around 33.90. If the option decreases in value by 50-60%, buy it back for a nice gain. If the stock keeps declining, however, by no means allow it to increase by more than 80% nor to go in-the-money (below 30.00) before covering it for a loss. The bid/ask spread for this put is decent enough and the trading volume and open interest numbers are very good, too. Keep your account risk at 1% maximum for this trade and be sure to follow the basic outline for when to take profits/cut losses, should this stock soon break to the upside as anticipated. Trade wisely until we meet here again. |
Freelance financial markets writer and online publisher of the Trendzetterz.com S&P 500 Weekly Forecast service.
| Title: | Market consultant and writer |
| Company: | Trendzetterz |
| Address: | 81 Hickory Hollow Drive |
| Crossville, TN 38555 | |
| Phone # for sales: | 904-303-4814 |
| Website: | trendzetterz.com |
| E-mail address: | support@trendzetterz.com |
Traders' Resource Links | |
| Trendzetterz has not added any product or service information to TRADERS' RESOURCE. | |
Click here for more information about our publications!
PRINT THIS ARTICLE

Request Information From Our Sponsors
- VectorVest, Inc.
- Executive Premier Workshop
- One-Day Options Course
- OptionsPro
- Retirement Income Workshop
- Sure-Fire Trading Systems (VectorVest, Inc.)
- Trading as a Business Workshop
- VectorVest 7 EOD
- VectorVest 7 RealTime/IntraDay
- VectorVest AutoTester
- VectorVest Educational Services
- VectorVest OnLine
- VectorVest Options Analyzer
- VectorVest ProGraphics v6.0
- VectorVest ProTrader 7
- VectorVest RealTime Derby Tool
- VectorVest Simulator
- VectorVest Variator
- VectorVest Watchdog
- StockCharts.com, Inc.
- Candle Patterns
- Candlestick Charting Explained
- Intermarket Technical Analysis
- John Murphy on Chart Analysis
- John Murphy's Chart Pattern Recognition
- John Murphy's Market Message
- MurphyExplainsMarketAnalysis-Intermarket Analysis
- MurphyExplainsMarketAnalysis-Visual Analysis
- StockCharts.com
- Technical Analysis of the Financial Markets
- The Visual Investor