

HOT TOPICS LIST
- MACD
- Fibonacci
- RSI
- Gann
- ADXR
- Stochastics
- Volume
- Triangles
- Futures
- Cycles
- Volatility
- ZIGZAG
- MESA
- Retracement
- Aroon
INDICATORS LIST
LIST OF TOPICS
PRINT THIS ARTICLE
by Billy Williams
Alcoa, Inc. (AA) has been off the grid for awhile, but now, after an iron cross occurred, is trading higher than it has been in the last three years.
Position: Hold
Billy Williams
Billy Williams has been trading the markets for 27 years, specializing in momentum trading with stocks and options.
PRINT THIS ARTICLE
OPTIONS TRADING
Iron Cross And Credit Spreads
07/16/14 03:48:20 PMby Billy Williams
Alcoa, Inc. (AA) has been off the grid for awhile, but now, after an iron cross occurred, is trading higher than it has been in the last three years.
Position: Hold
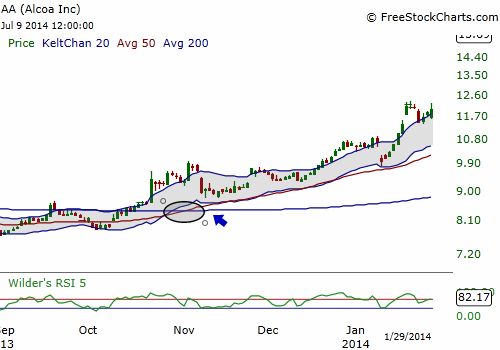
| The stock of Alcoa, Inc. (AA) has been a mainstay on Wall Street going back decades as one of the "go-to" bluechips, but the stock fell on hard times during periods of intense competition. AA fell further during the 2008 housing debacle, but recently the stock has shown signs of resurgence. Today, the stock is trading higher than it has in the last three years and may offer you the opportunity to rack up some solid gains if you know how to play it. Looking back, it's easy to understand why the stock has been ignored on Wall Street and by most traders. The stock's attracted the bears who hammered the stock lower, but in November, 2013, AA formed an iron cross in its technical pattern and has been on the march to higher ground ever since. An iron cross is a changing of the guard between the 50-day simple moving average (SMA) and the 200-day SMA. Both technical indicators are closely watched by the institutional traders and when the 50-day crosses back through the 200-day SMA opposite of its given direction at the time, it signals a possible trend reversal. An iron cross formed on the stock chart of AA in November 2013 (Figure 1) and indicated that the trend might reverse. For skilled traders this was an opportunity to latch onto a new trend but trading any kind of reversal is a tricky proposition. Sometimes the trend will reverse and fortunes can be made, but often, the existing trend will dominate and price will eventually settle back into its current direction. |
|
| Figure 1. An iron cross was formed when the 50-day simple moving average (SMA) crossed above the 50-day SMA signaling a trend reversal. |
| Graphic provided by: www.freestockcharts.com. |
| |
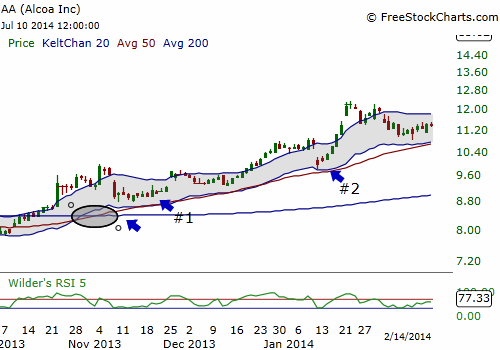
| The smart play is to use options to help mitigate the risk and to lock in profits using credit spreads. After the iron cross formed, using Keltner channels on AA's price action, you can better see where the dips and pullbacks are taking place and time your entries into the new trend. Using a bull put spread, you can sell the call option at the bottom of the Keltner channel while buying a put option at a lower strike price to control risk if the reversal fails or price suddenly moves against you. The riskiest place to put on a credit spread is the first pullback after the iron cross (Figure 2). You want the new bullish price action to first achieve a steady series of higher highs and higher lows in its price action before committing any capital. You also want to see the new trend take out the previous price high, preferably close above it, before looking to buy into the dips. That said, bull put spreads can put the odds in your favor almost three-to-one by staying on the side of the trend. If price trades at the same level as when you put on the spread trade, trades higher in your favor, or if it moves against you within the limits of the premium you received to offset the risk, then you will likely emerge successful versus merely directional trading with options. |
|
| Figure 2. At Point #1 and Point #2 are pullbacks that offered you the opportunity to put on a low-risk bull put spread that would have potentially earned you small consistent profits with minimum risk and high odds of success. |
| Graphic provided by: www.freestockcharts.com. |
| |
| Trading options by themselves puts you at a disadvantage since time decay is working against you. With credit spreads like the bull put spread you have time decay working in your favor, not against you. After the initial pullback following the iron cross, wait for price to pullback and touch the lower Keltner channel and sell the call option that is at-the-money or slightly in-the-money that has less than 30 days till expiration. Be sure to simultaneously buy the lower price put option with the lower strike price to act as a hedge. Be sure that the 50-day SMA and the 200-day SMA are sloping upward to stay on the right side of the trend. Locking in small consistent profits this way will help keep your equity curve smooth and curving upward as well as act as a buffer for any unexpected loss. |
Billy Williams has been trading the markets for 27 years, specializing in momentum trading with stocks and options.
| Company: | StockOptionSystem.com |
| E-mail address: | stockoptionsystem.com@gmail.com |
Traders' Resource Links | |
| StockOptionSystem.com has not added any product or service information to TRADERS' RESOURCE. | |
Click here for more information about our publications!
Comments

Request Information From Our Sponsors
- VectorVest, Inc.
- Executive Premier Workshop
- One-Day Options Course
- OptionsPro
- Retirement Income Workshop
- Sure-Fire Trading Systems (VectorVest, Inc.)
- Trading as a Business Workshop
- VectorVest 7 EOD
- VectorVest 7 RealTime/IntraDay
- VectorVest AutoTester
- VectorVest Educational Services
- VectorVest OnLine
- VectorVest Options Analyzer
- VectorVest ProGraphics v6.0
- VectorVest ProTrader 7
- VectorVest RealTime Derby Tool
- VectorVest Simulator
- VectorVest Variator
- VectorVest Watchdog
- StockCharts.com, Inc.
- Candle Patterns
- Candlestick Charting Explained
- Intermarket Technical Analysis
- John Murphy on Chart Analysis
- John Murphy's Chart Pattern Recognition
- John Murphy's Market Message
- MurphyExplainsMarketAnalysis-Intermarket Analysis
- MurphyExplainsMarketAnalysis-Visual Analysis
- StockCharts.com
- Technical Analysis of the Financial Markets
- The Visual Investor