HOT TOPICS LIST
- MACD
- Fibonacci
- RSI
- Gann
- ADXR
- Stochastics
- Volume
- Triangles
- Futures
- Cycles
- Volatility
- ZIGZAG
- MESA
- Retracement
- Aroon
INDICATORS LIST
LIST OF TOPICS
PRINT THIS ARTICLE
by Koos van der Merwe
When a stock keeps rising, when do you know to take profits?
Position: Sell
Koos van der Merwe
Has been a technical analyst since 1969, and has worked as a futures and options trader with First Financial Futures in Johannesburg, South Africa.
PRINT THIS ARTICLE
ELLIOTT WAVE
A Look At Alcoa, Inc.
07/15/14 04:31:34 PMby Koos van der Merwe
When a stock keeps rising, when do you know to take profits?
Position: Sell
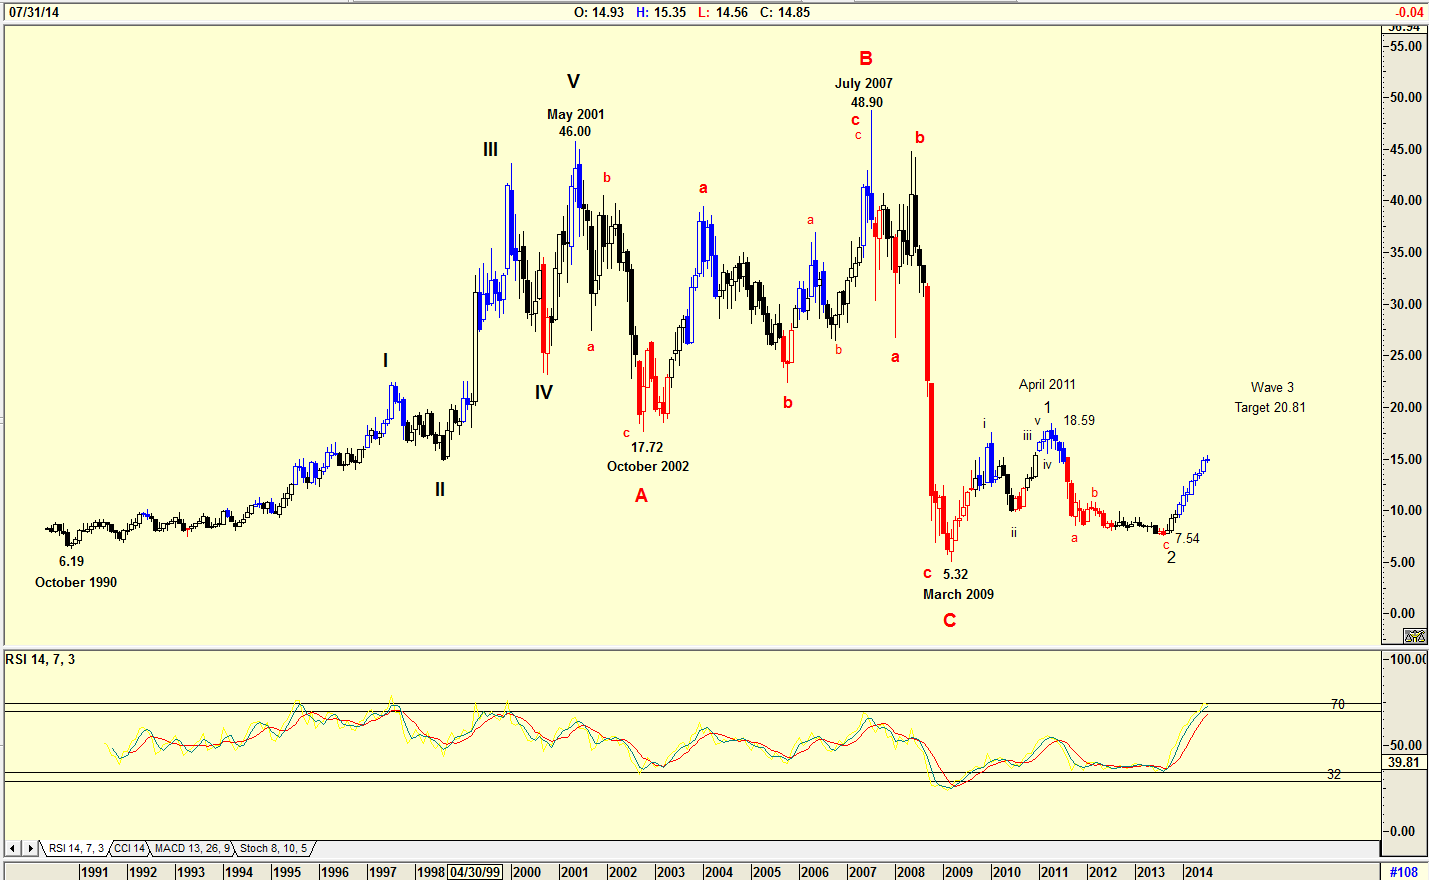
| Alcoa Inc. (AA) is the world's leading producer and manager of primary aluminum serving many industries. The company also markets consumer brands. The share price has vacillated a great deal, reaching a high of $49 in July 2007 and a low of $5.22 by March 2009. Is this a share you should place on your watch list? |

|
| Figure 1. Monthly chart with Elliott Wave count. |
| Graphic provided by: AdvancedGET. |
| |
| The chart in Figure 1 is a monthly chart showing how AA rose from a low of $6.19 in October 1990 to a high of $46 by May 2001. The share price then fell to a low of $17.72 by October 2002. An Elliott Wave count suggests that the share price is in a Wave 3 bull trend, but the relative strength index (RSI) is at overbought levels suggesting that a correction could occur in the months ahead. The RSI must turn down and give a sell signal by breaking below the 70 horizontal line. This could take many months which will allow the price to test the April 2011 resistance of $18.59. The target for Wave 3 is $20.81 should the wave count be correct. A wave 3 should equal a Wave 1 (18.59 - 5.32 = 13.27. 7.54 + 13.27 = 20.81). You must keep in mind that the Elliott Wave is a signpost in the wilderness and can change direction at any moment. |

|
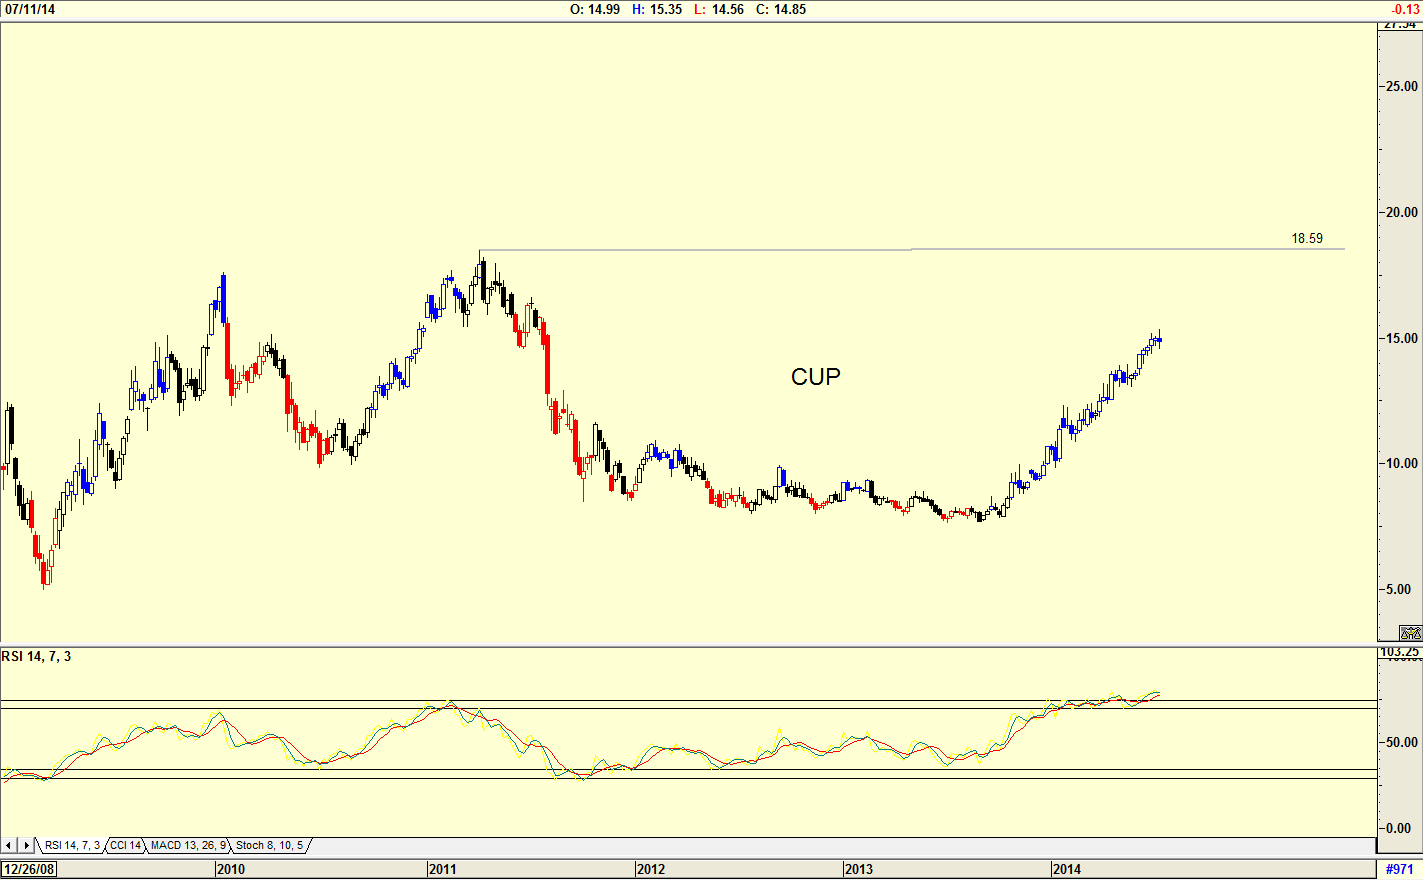
| Figure 2. Weekly chart showing possible cup & handle formation developing. |
| Graphic provided by: AdvancedGET. |
| |
| The weekly chart in Figure 2 suggests that a cup & handle formation could be developing. The price need not necessarily rise to the $18.59 level, but could start turning down now, forming a handle (resistance level). The candlestick formation is suggesting a doji, which indicates uncertainty, and with the RSI at overbought levels (a sell signal has not been given) we could see the share moving down forming the handle. When the share breaks above the handle then the formation will suggest a buy. |

|
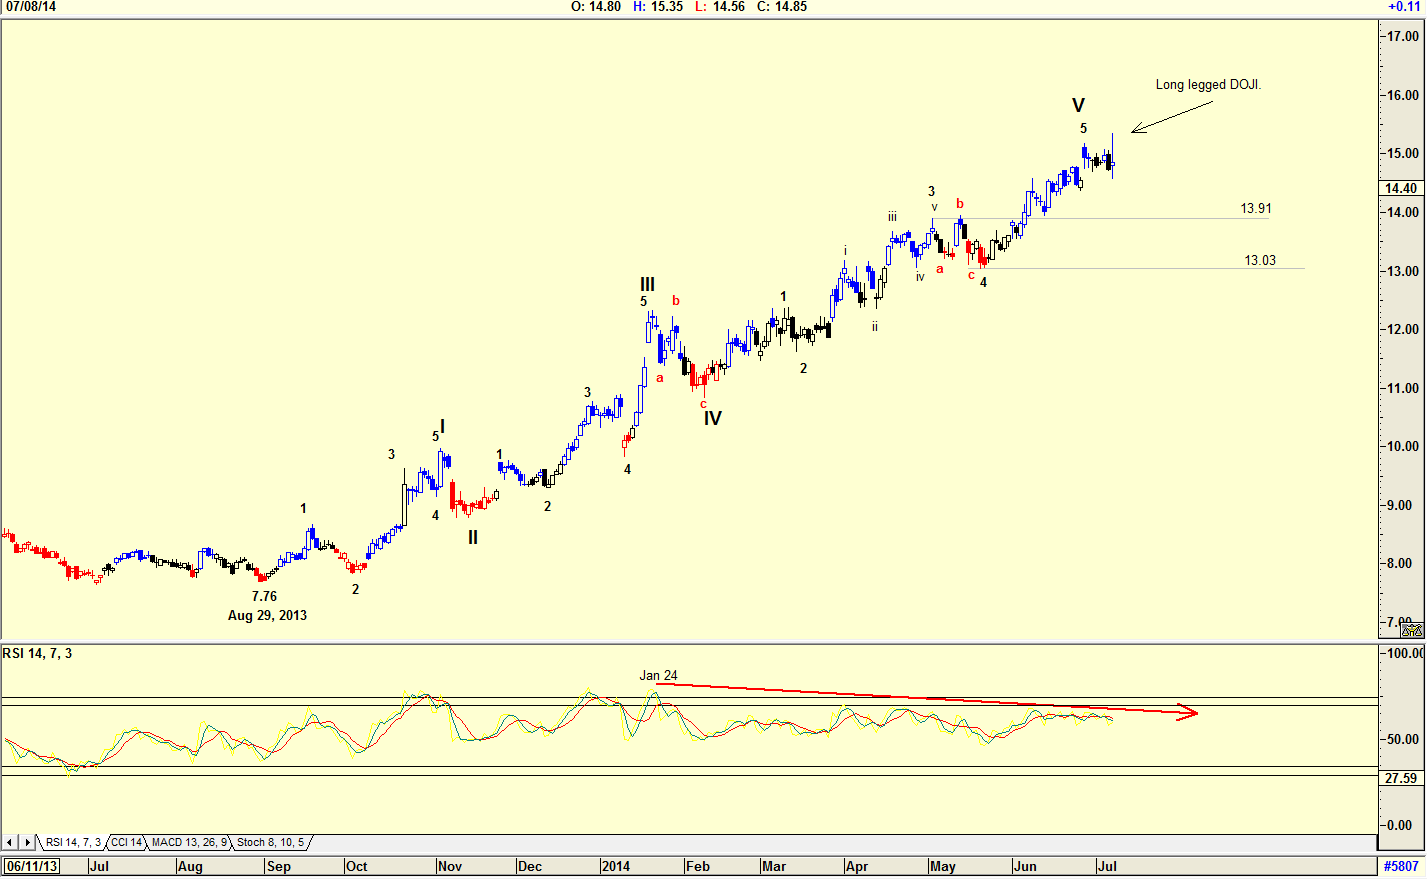
| Figure 3. Daily chart suggesting an Elliott Wave top. |
| Graphic provided by: AdvancedGET. |
| |
| The chart in Figure 3 is a daily chart with an Elliott Wave count suggesting a WAVE V top. This is confirmed by the RSI indicator which gave a sell signal on January 24, 2014. What is concerning about the chart is the Elliott Wave rule that a wave 5 should be equal to a wave 1. As you can see from the chart, WAVE V is a great deal larger than WAVE I, suggesting that the count could be incorrect. Time will tell. Should WAVE V be correct, then we could expect a correction to the 4th wave of lesser degree, that is, somewhere between $13.03 and $13.91. Note the long legged doji candlestick formation suggesting uncertainty. I would not be a buyer of AA at the moment, but would wait for the correction to somewhere between $13.03 to $13.91. |
Has been a technical analyst since 1969, and has worked as a futures and options trader with First Financial Futures in Johannesburg, South Africa.
| Address: | 3256 West 24th Ave |
| Vancouver, BC | |
| Phone # for sales: | 6042634214 |
| E-mail address: | petroosp@gmail.com |
Click here for more information about our publications!
PRINT THIS ARTICLE

Request Information From Our Sponsors
- StockCharts.com, Inc.
- Candle Patterns
- Candlestick Charting Explained
- Intermarket Technical Analysis
- John Murphy on Chart Analysis
- John Murphy's Chart Pattern Recognition
- John Murphy's Market Message
- MurphyExplainsMarketAnalysis-Intermarket Analysis
- MurphyExplainsMarketAnalysis-Visual Analysis
- StockCharts.com
- Technical Analysis of the Financial Markets
- The Visual Investor
- VectorVest, Inc.
- Executive Premier Workshop
- One-Day Options Course
- OptionsPro
- Retirement Income Workshop
- Sure-Fire Trading Systems (VectorVest, Inc.)
- Trading as a Business Workshop
- VectorVest 7 EOD
- VectorVest 7 RealTime/IntraDay
- VectorVest AutoTester
- VectorVest Educational Services
- VectorVest OnLine
- VectorVest Options Analyzer
- VectorVest ProGraphics v6.0
- VectorVest ProTrader 7
- VectorVest RealTime Derby Tool
- VectorVest Simulator
- VectorVest Variator
- VectorVest Watchdog
