

HOT TOPICS LIST
- MACD
- Fibonacci
- RSI
- Gann
- ADXR
- Stochastics
- Volume
- Triangles
- Futures
- Cycles
- Volatility
- ZIGZAG
- MESA
- Retracement
- Aroon
INDICATORS LIST
LIST OF TOPICS
PRINT THIS ARTICLE
by Billy Williams
The Gatsby Index is showing weakness among this stock class but there is one stock among them about to breakout.
Position: Accumulate
Billy Williams
Billy Williams has been trading the markets for 27 years, specializing in momentum trading with stocks and options.
PRINT THIS ARTICLE
TRIANGLES
The Gatsby Index's Leading Stock
07/14/14 04:38:58 PMby Billy Williams
The Gatsby Index is showing weakness among this stock class but there is one stock among them about to breakout.
Position: Accumulate
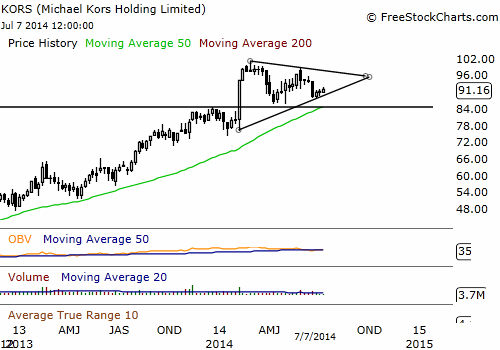
| The Gatsby Index is a compilation of stocks that tend to cater to higher-end customers in the attempt to track the spending habits of wealthier consumers in the economy. So far, year-to-date, the index is down by over 7% which could indicate that wealthy consumers are tightening their wallets, but the general market is also down by the same percentage. Overall, the Gatsby Index is holding up relatively well but there is one stock that stands out from the rest of the pack and looks like its ready to make a bull run. Michael Kors Holdings Limited (KORS) is engaged in the design, marketing, distribution, and retailing of branded women's apparel and accessories, as well as men's apparel. The company started off strong right out of the gate back in 2011 when it launched its IPO, and has continued to outperform most of the market. The weekly chart in Figure 1 shows that KORS has made a steady series of higher highs and higher lows in its price action while the OBV indicator reveals that the stock has been steadily under accumulation. The steady accumulation of the company's shares indicate that the institutions are buying up shares. This can cause the stock's value to rise as the major buyers add to their positions and demand is hot for the company's share causing prices to be driven higher. |
|
| Figure 1. KORS is the strongest among the Gatsby stocks and is forming a bullish triangle that indicates the stock may break higher. |
| Graphic provided by: www.freestockcharts.com. |
| |
| This reflects that Wall Street has a positive view of the company's future and that demand is high for KORS which puts the stock firmly in the bull's control. On February 4, 2014, KORS exploded higher in a bullish price gap that opened with a 17-point difference between the close of the previous trading day and that morning's opening price. Also, volume for the day was almost 600% of the stock's 50-day average daily volume. KORS went on to trade as high as $101 on February 25, 2014 before declining and settling into a trading range. Price action has been sloppy and loose but KORS has managed to keep trading near its all-time price high and the price gap lying below has still not been closed. What is interesting in KORS' current price action is that it looks as if the stock is forming a triangle pattern while still sloping upward (Figure 2). It's still too early to tell whether the pattern will hold but, so far, it looks promising. |

|
| Figure 2. It's within this trading range that KORS may offer an early entry or you might have to wait for the stock to break above the triangle's upper trendline. In either case, fortune favors the prepared so start preparing now for tomorrow's opportunity. |
| Graphic provided by: www.freestockcharts.com. |
| |
| Given the strength KORS is showing as it trades within 10% of its all-time high, a trade setup could present itself in the near future. There are a couple of ways you could play this — one being as price trades through the upper trendline of the triangle pattern on higher volume, and the other to find a low-risk entry early into the move before KORS breaks higher. KORS is hovering around its 10-day SMA and if it manages to pullback below the SMA and then trade back above the SMA while losing higher above that SMA on higher volume exceeding the previous 10-day's volume level, then that could be the early entry you'd be looking for. Or, you could just wait to see if the triangle pattern holds and trade as it breaks the upper trendline. Whichever way you decide to trade KORS be sure to use a stop-loss of no more than 7% away from your entry point and risk no more than 2% of your total trade equity. |
Billy Williams has been trading the markets for 27 years, specializing in momentum trading with stocks and options.
| Company: | StockOptionSystem.com |
| E-mail address: | stockoptionsystem.com@gmail.com |
Traders' Resource Links | |
| StockOptionSystem.com has not added any product or service information to TRADERS' RESOURCE. | |
Click here for more information about our publications!
PRINT THIS ARTICLE

Request Information From Our Sponsors
- StockCharts.com, Inc.
- Candle Patterns
- Candlestick Charting Explained
- Intermarket Technical Analysis
- John Murphy on Chart Analysis
- John Murphy's Chart Pattern Recognition
- John Murphy's Market Message
- MurphyExplainsMarketAnalysis-Intermarket Analysis
- MurphyExplainsMarketAnalysis-Visual Analysis
- StockCharts.com
- Technical Analysis of the Financial Markets
- The Visual Investor
- VectorVest, Inc.
- Executive Premier Workshop
- One-Day Options Course
- OptionsPro
- Retirement Income Workshop
- Sure-Fire Trading Systems (VectorVest, Inc.)
- Trading as a Business Workshop
- VectorVest 7 EOD
- VectorVest 7 RealTime/IntraDay
- VectorVest AutoTester
- VectorVest Educational Services
- VectorVest OnLine
- VectorVest Options Analyzer
- VectorVest ProGraphics v6.0
- VectorVest ProTrader 7
- VectorVest RealTime Derby Tool
- VectorVest Simulator
- VectorVest Variator
- VectorVest Watchdog