HOT TOPICS LIST
- MACD
- Fibonacci
- RSI
- Gann
- ADXR
- Stochastics
- Volume
- Triangles
- Futures
- Cycles
- Volatility
- ZIGZAG
- MESA
- Retracement
- Aroon
INDICATORS LIST
LIST OF TOPICS
PRINT THIS ARTICLE
by Koos van der Merwe
When a stock continues to rise, it means a correction must be on the cards. But that's not to say that a short-term trade is not possible.
Position: Buy
Koos van der Merwe
Has been a technical analyst since 1969, and has worked as a futures and options trader with First Financial Futures in Johannesburg, South Africa.
PRINT THIS ARTICLE
STRATEGIES
A Look At Easyhome Ltd.
07/11/14 04:55:39 PMby Koos van der Merwe
When a stock continues to rise, it means a correction must be on the cards. But that's not to say that a short-term trade is not possible.
Position: Buy
| Looking for a stock to invest in and hold for the long term is always a challenge. A good start is to look at stock prices that have risen strongly and are now due for a correction. Easyhome Ltd. (EH-T) is one of those shares. The company is Canada's largest merchandise leasing company and the third largest in North America. The company also offers a variety of financial services. |

|
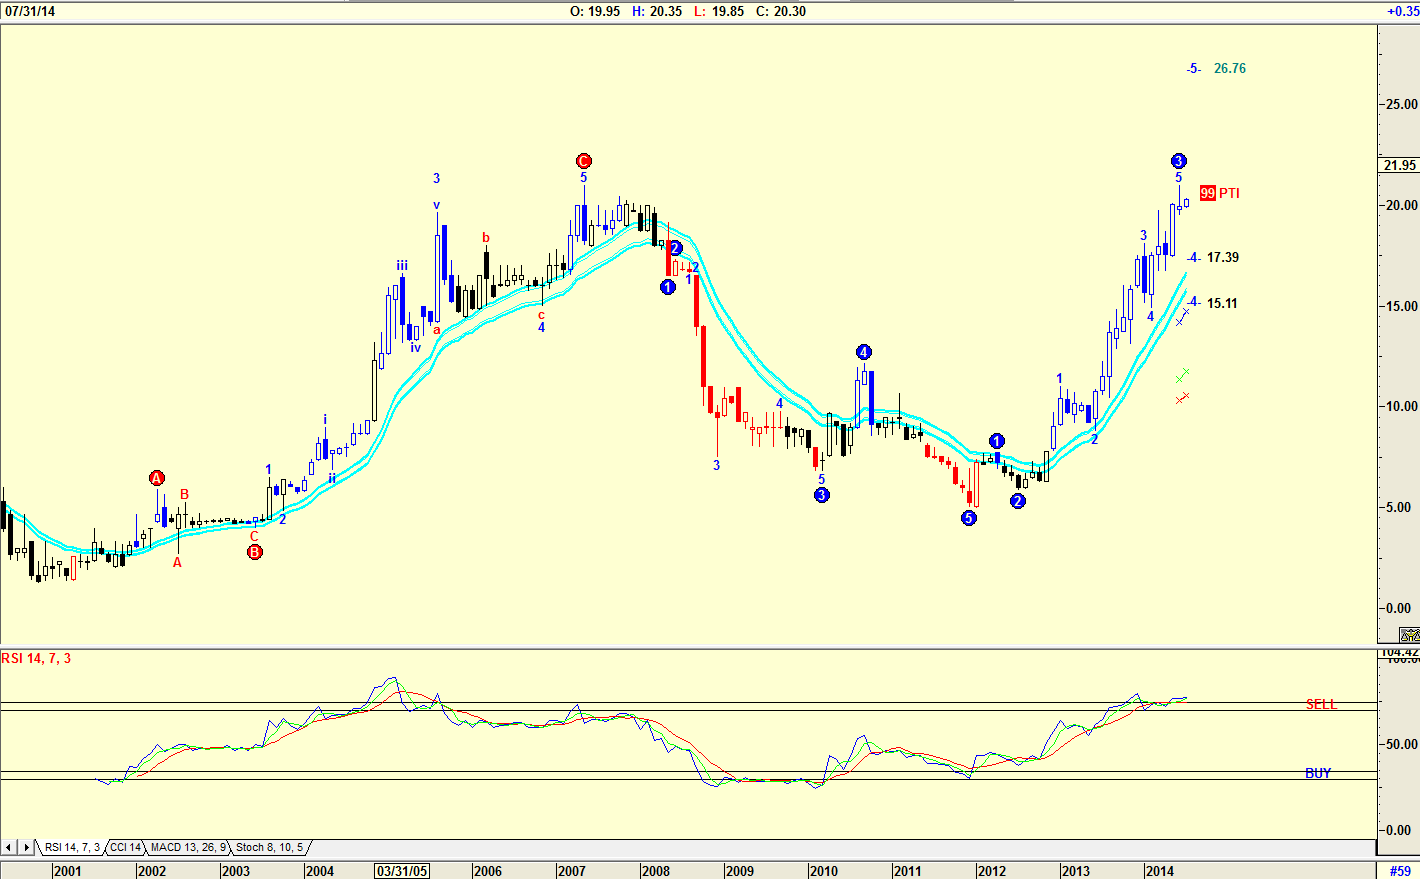
| Figure 1. Monthly chart with Elliott wave count. |
| Graphic provided by: AdvancedGET. |
| |
| The chart in Figure 1 is a monthly chart with an Elliott wave count suggesting that a WAVE 3 could be topping out. The wave count is suggesting a target of $17.39 or $15.11. The Probability Index (PTI) is 99, which is very strong. With the relative strength index (RSI) at overbought levels, the correction looks imminent. The wave count offered by the Advanced GET program is suggesting that once WAVE 4 is complete, the target for WAVE 5 is $26.76. |

|
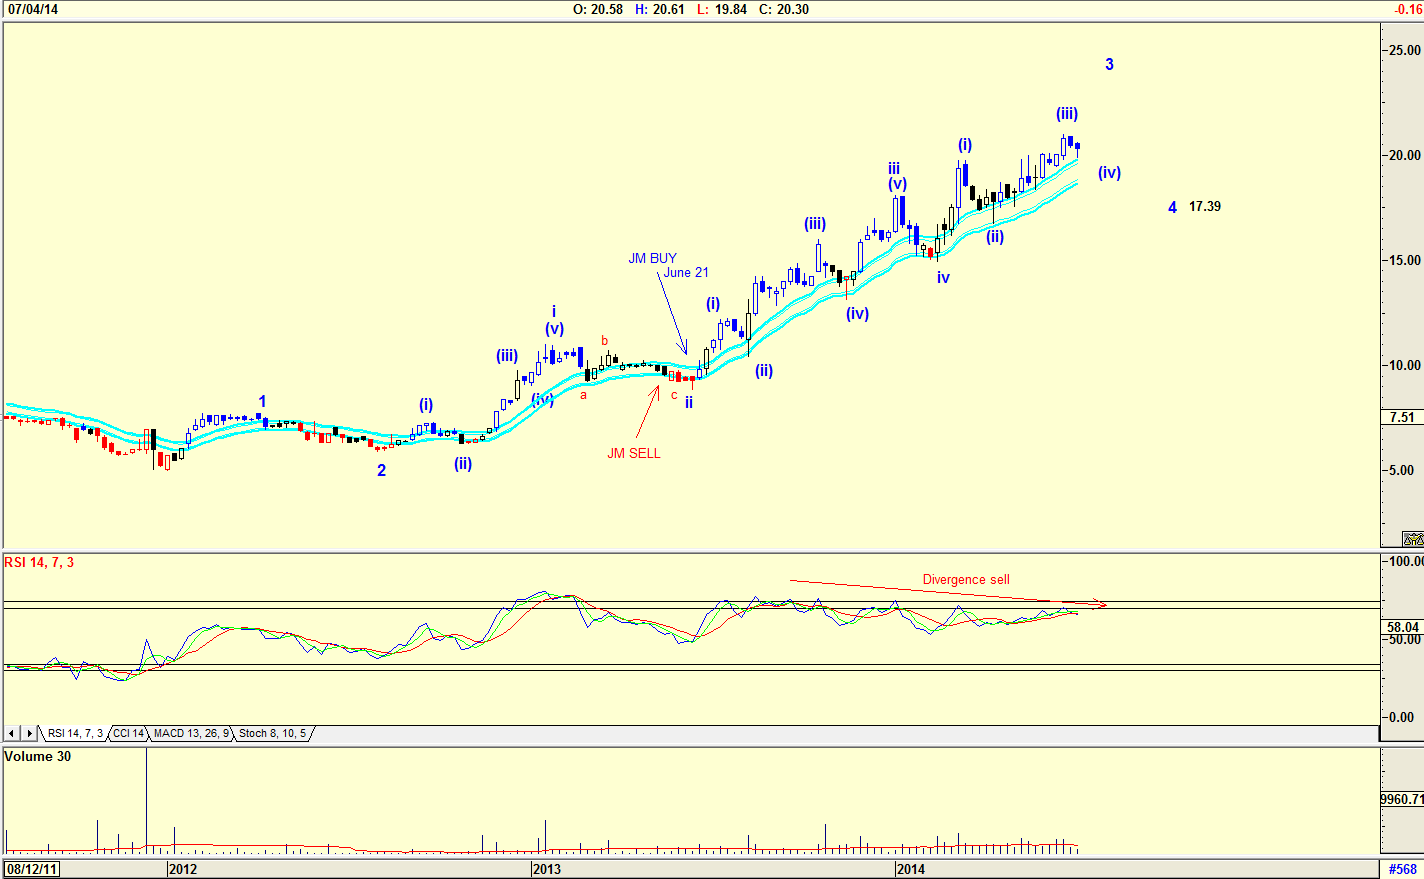
| Figure 2. Weekly Chart with Elliott wave count. |
| Graphic provided by: AdvancedGET. |
| |
| The weekly chart shown in Figure 2 has an Elliott wave count identical to the wave count on the monthly chart in Figure 1, with the exception of the last wave count, which is suggesting that the share is in a wave iv of Wave 3 with Wave 4 to the target of $17.39 still to come once wave v of Wave 3 is complete. The RSI is suggesting a divergence sell signal, which is when the RSI indicator is at overbought levels and is moving lower while the price of the stock is making new highs. Note the JM Internal Band indicator gave a buy signal on June 21, 2014. The JM Internal band indicator is a 15-period simple moving average (SMA) offset by 2% positive and 2% negative. A move above the upper band suggests a buy and below the lower band a sell. Volume appears to be average. |

|
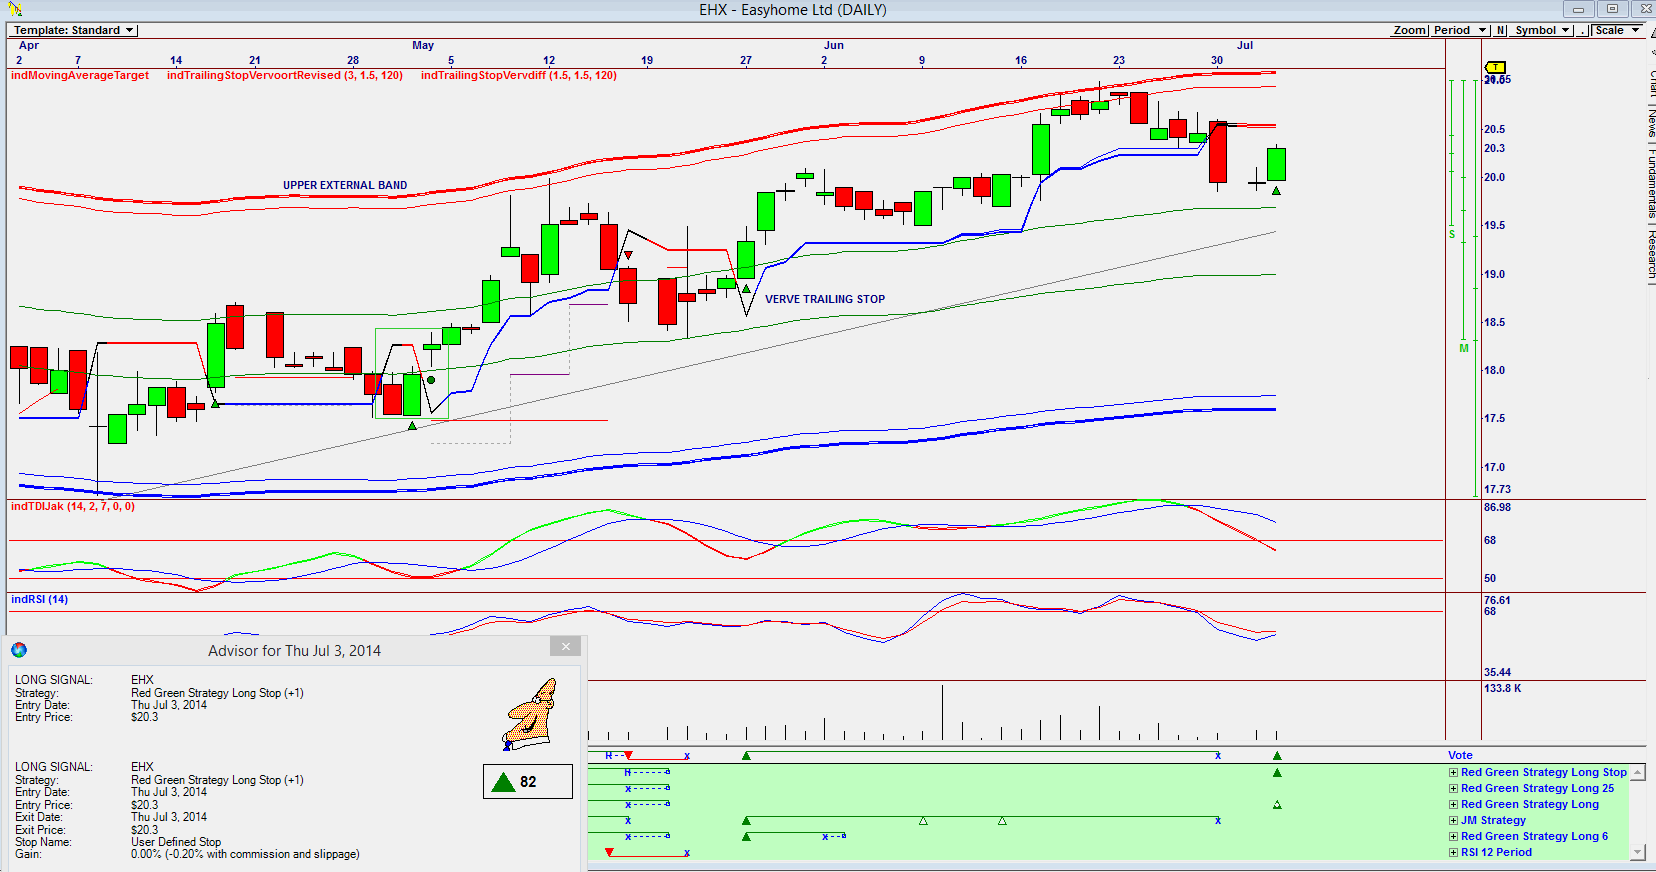
| Figure 3. Daily Omnitrader chart indicating a buy. |
| Graphic provided by: Omnitrader. |
| |
| The chart in Figure 3 is a daily Omnitrader chart that suggests a new buy signal on the Vote line. The Advisor rating is very strong at 82, based on the Red Green Strategy Long stop. It is suggesting that a buy at a price of $20.30 is a good bet. Note the RSI — although it has not fallen below the 32 horizontal level it is suggesting a buy is turning up. The indTDIJak indicator however is still suggesting weakness. I would be a buyer of Easyhome, listed on the Toronto stock exchange, but as a trade and not as a long-term investment. Here I would wait for the 4th wave correction to complete as suggested by the weekly chart in Figure 2 before I buy the share for a long-term hold. |
Has been a technical analyst since 1969, and has worked as a futures and options trader with First Financial Futures in Johannesburg, South Africa.
| Address: | 3256 West 24th Ave |
| Vancouver, BC | |
| Phone # for sales: | 6042634214 |
| E-mail address: | petroosp@gmail.com |
Click here for more information about our publications!
PRINT THIS ARTICLE

|

Request Information From Our Sponsors
- StockCharts.com, Inc.
- Candle Patterns
- Candlestick Charting Explained
- Intermarket Technical Analysis
- John Murphy on Chart Analysis
- John Murphy's Chart Pattern Recognition
- John Murphy's Market Message
- MurphyExplainsMarketAnalysis-Intermarket Analysis
- MurphyExplainsMarketAnalysis-Visual Analysis
- StockCharts.com
- Technical Analysis of the Financial Markets
- The Visual Investor
- VectorVest, Inc.
- Executive Premier Workshop
- One-Day Options Course
- OptionsPro
- Retirement Income Workshop
- Sure-Fire Trading Systems (VectorVest, Inc.)
- Trading as a Business Workshop
- VectorVest 7 EOD
- VectorVest 7 RealTime/IntraDay
- VectorVest AutoTester
- VectorVest Educational Services
- VectorVest OnLine
- VectorVest Options Analyzer
- VectorVest ProGraphics v6.0
- VectorVest ProTrader 7
- VectorVest RealTime Derby Tool
- VectorVest Simulator
- VectorVest Variator
- VectorVest Watchdog
