

HOT TOPICS LIST
- MACD
- Fibonacci
- RSI
- Gann
- ADXR
- Stochastics
- Volume
- Triangles
- Futures
- Cycles
- Volatility
- ZIGZAG
- MESA
- Retracement
- Aroon
INDICATORS LIST
LIST OF TOPICS
PRINT THIS ARTICLE
by Chaitali Mohile
The stock of Amazon.com Inc. (AMZN) is struggling to move back into its bullish zone. Is this the time to buy the stock?
Position: Hold
Chaitali Mohile
Active trader in the Indian stock markets since 2003 and a full-time writer. Trading is largely based upon technical analysis.
PRINT THIS ARTICLE
TECHNICAL ANALYSIS
Is It Time To Buy Amazon?
07/09/14 03:05:47 PMby Chaitali Mohile
The stock of Amazon.com Inc. (AMZN) is struggling to move back into its bullish zone. Is this the time to buy the stock?
Position: Hold
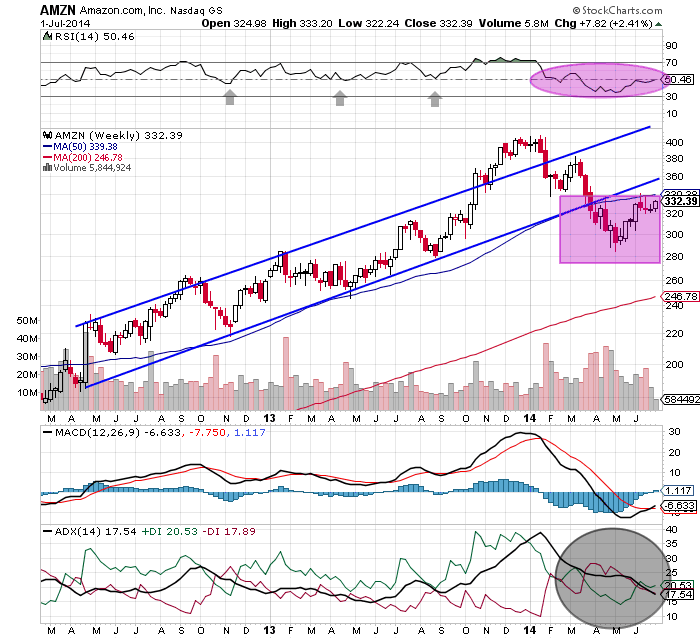
| Amazon.com (AMZN) was in a robust long-term uptrend. After the breathtaking correction of 2008-2009, the stock entered a bullish trend. Since then, the stock has rallied from double digit lows to triple digit highs, offering huge profits to those who trade its stock. An ascending channel marked on the weekly time frame in Figure 1 shows the steady uptrend rally of two years. The stock marked an all-time high at 425 levels and retraced its movements within the channel. This sudden bullish breakout dragged the indicators into an overbought territory. The average directional index (ADX)(14), the relative strength index (RSI)(14), and the moving average convergence/divergence (MACD)(12,26,9) climbed to their respective overheated regions. After that, AMZN reversed from the new high formed in December 2013. |
|
| FIGURE 1: AMZN, WEEKLY. |
| Graphic provided by: StockCharts.com. |
| |
| Later, an evening star candlestick pattern — a bearish reversal formation — formed near the upper trendline resistance. This bearish candlestick pattern was followed by another strong formation of three black crows. These two bearish patterns brought the price down to below lower trendline support, thus, weakening any bullish sentiments. However, AMZN established support at 280 levels and began rallying toward the newly formed 50-period moving average (MA) resistance. The stock has been struggling below this technical resistance for the past few weeks. |
| The RSI(14) is jittery near the center line, indicating lack of bullish strength. The ADX(14) shows a weak trend and the negative MACD(12,26,9) is suggesting uncertainty about the bullish breakout. In addition, AMZN has to breach two resistances consecutively, the lower trendine resistance and the 50-period MA resistance. Hence, a buying signal will be reflected once the stock converts these resistances to support and the technical indicators turn in favor of the buyers. After the confirmed bullish breakout, those holding long positions can add to their positions, and those waiting on the sidelines can grab the opportunity of fresh buying in AMZN. |
|
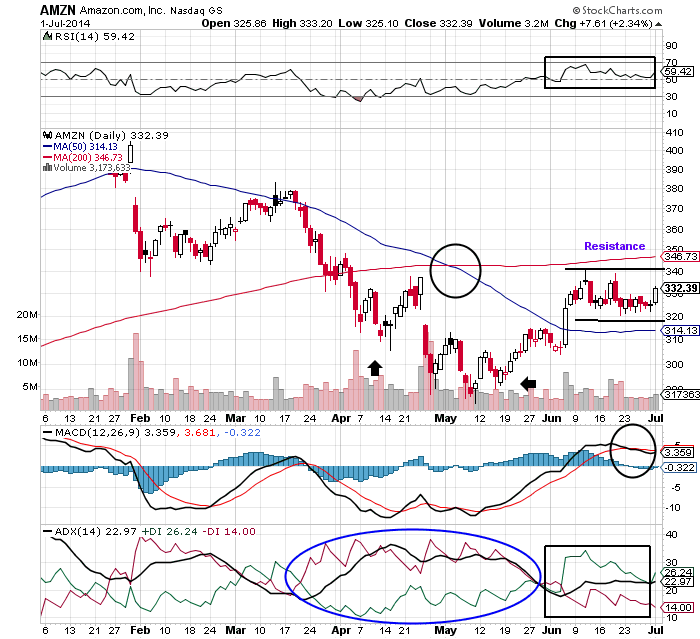
| FIGURE 2: AMZN, DAILY. |
| Graphic provided by: StockCharts.com. |
| |
| Figure 2 shows high volatility on the daily chart. During the downside journey, AMZN formed two lower lows with a small gap down. Due to the bearish crossover in the price chart, the 200-day moving average (MA) has become the prime resistance of the potential bullish rally. Currently, the stock is consolidating between the two moving averages. Since the uptrend is developing, the RSI(14) is suggesting stable bullish strength, and the MACD(12,26,9) is sustaining in the positive area, we can consider this sideways rally as a bullish consolidation. |
| Hence AMZN should be placed at the top of your watch-list. The low-risk buying opportunity is likely to occur near 355/360 levels. Therefore, traders may have to wait for a few weeks to trigger their trades. |
Active trader in the Indian stock markets since 2003 and a full-time writer. Trading is largely based upon technical analysis.
| Company: | Independent |
| Address: | C1/3 Parth Indraprasth Towers. Vastrapur |
| Ahmedabad, Guj 380015 | |
| E-mail address: | chaitalimohile@yahoo.co.in |
Traders' Resource Links | |
| Independent has not added any product or service information to TRADERS' RESOURCE. | |
Click here for more information about our publications!
PRINT THIS ARTICLE

Request Information From Our Sponsors
- StockCharts.com, Inc.
- Candle Patterns
- Candlestick Charting Explained
- Intermarket Technical Analysis
- John Murphy on Chart Analysis
- John Murphy's Chart Pattern Recognition
- John Murphy's Market Message
- MurphyExplainsMarketAnalysis-Intermarket Analysis
- MurphyExplainsMarketAnalysis-Visual Analysis
- StockCharts.com
- Technical Analysis of the Financial Markets
- The Visual Investor
- VectorVest, Inc.
- Executive Premier Workshop
- One-Day Options Course
- OptionsPro
- Retirement Income Workshop
- Sure-Fire Trading Systems (VectorVest, Inc.)
- Trading as a Business Workshop
- VectorVest 7 EOD
- VectorVest 7 RealTime/IntraDay
- VectorVest AutoTester
- VectorVest Educational Services
- VectorVest OnLine
- VectorVest Options Analyzer
- VectorVest ProGraphics v6.0
- VectorVest ProTrader 7
- VectorVest RealTime Derby Tool
- VectorVest Simulator
- VectorVest Variator
- VectorVest Watchdog