HOT TOPICS LIST
- MACD
- Fibonacci
- RSI
- Gann
- ADXR
- Stochastics
- Volume
- Triangles
- Futures
- Cycles
- Volatility
- ZIGZAG
- MESA
- Retracement
- Aroon
INDICATORS LIST
LIST OF TOPICS
PRINT THIS ARTICLE
by Gary Grosschadl
The last time this index look precarious, the markets hit a downleg and now it's showing another interesting juncture.
Position: N/A
Gary Grosschadl
Independent Canadian equities trader and technical analyst based in Peterborough
Ontario, Canada.
PRINT THIS ARTICLE
CHART ANALYSIS
Bank Index Closing In On Another Test
10/18/02 10:51:04 AMby Gary Grosschadl
The last time this index look precarious, the markets hit a downleg and now it's showing another interesting juncture.
Position: N/A
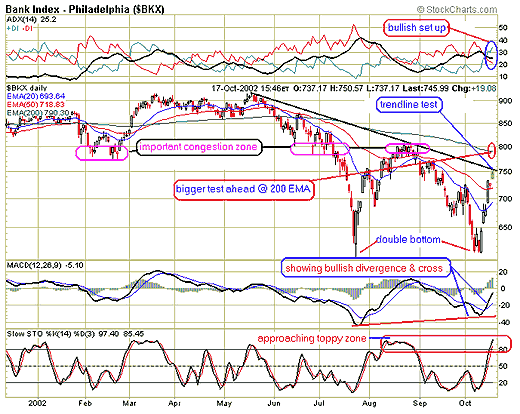
In a previous analysis (Bank Index Being Tested 06/21/02 11:10:45 AM PST) I pointed out: "The bank index has been in a long term 5-year ascending triangle and this is considered a bullish formation. However a sustained move below the lower trendline would negate the bullish outlook. Last week when this index touched 800 it bounced off this 5-year lower trendline. This was a timely analysis as the markets and this index tanked soon afterwards. The $BKX sank to below 610 and the Dow dropped 2000 points. Now things look very different. This daily chart shows that the bank index has made a big double bottom formation looking fairly symmetrical, giving added credence. |

|
| Graphic provided by: stockcharts.com. |
| |
| Two tests coming up as shown on this chart: First, the trendline challenge at the 750 mark and then the 200-period EMA at 790. Note the importance of that 790 zone where previous congestion lies as well as the trough for the double bottom pattern. If this bullish pattern fulfills according to the trough measurement, then this index may climb 200 points to hit new highs. But that is getting way ahead of ourselves. First it has to pass the "tests." |
| Success or failure here will be very telling as the main indices will do likewise as before. What happens with the bank index at these crucial points may tip the hand of the overall indices. For now it looks like the trendline test will pass so some upside is in order. |
Independent Canadian equities trader and technical analyst based in Peterborough
Ontario, Canada.
| Website: | www.whatsonsale.ca/financial.html |
| E-mail address: | gwg7@sympatico.ca |
Click here for more information about our publications!
Comments
Date: 10/22/02Rank: 2Comment:

Request Information From Our Sponsors
- VectorVest, Inc.
- Executive Premier Workshop
- One-Day Options Course
- OptionsPro
- Retirement Income Workshop
- Sure-Fire Trading Systems (VectorVest, Inc.)
- Trading as a Business Workshop
- VectorVest 7 EOD
- VectorVest 7 RealTime/IntraDay
- VectorVest AutoTester
- VectorVest Educational Services
- VectorVest OnLine
- VectorVest Options Analyzer
- VectorVest ProGraphics v6.0
- VectorVest ProTrader 7
- VectorVest RealTime Derby Tool
- VectorVest Simulator
- VectorVest Variator
- VectorVest Watchdog
- StockCharts.com, Inc.
- Candle Patterns
- Candlestick Charting Explained
- Intermarket Technical Analysis
- John Murphy on Chart Analysis
- John Murphy's Chart Pattern Recognition
- John Murphy's Market Message
- MurphyExplainsMarketAnalysis-Intermarket Analysis
- MurphyExplainsMarketAnalysis-Visual Analysis
- StockCharts.com
- Technical Analysis of the Financial Markets
- The Visual Investor
