HOT TOPICS LIST
- MACD
- Fibonacci
- RSI
- Gann
- ADXR
- Stochastics
- Volume
- Triangles
- Futures
- Cycles
- Volatility
- ZIGZAG
- MESA
- Retracement
- Aroon
INDICATORS LIST
LIST OF TOPICS
PRINT THIS ARTICLE
by Koos van der Merwe
With second quarter financial results being released on July 23rd, 2014 should you expect the stock price to keep rising till then?
Position: Accumulate
Koos van der Merwe
Has been a technical analyst since 1969, and has worked as a futures and options trader with First Financial Futures in Johannesburg, South Africa.
PRINT THIS ARTICLE
TECHNICAL ANALYSIS
How High Can Shares Of Praxair Inc. (PX) Go?
07/02/14 05:42:54 PMby Koos van der Merwe
With second quarter financial results being released on July 23rd, 2014 should you expect the stock price to keep rising till then?
Position: Accumulate
| Praxair Inc. (PX) is the largest industrial gas company in North and South America and one of the largest worldwide. The company supplies atmospheric process and speciality gases, as well as high performance coatings and related services. The company does business in more than 50 countries and has approximately 4,000 patents. With its past record, is this a share you should buy & hold? |

|
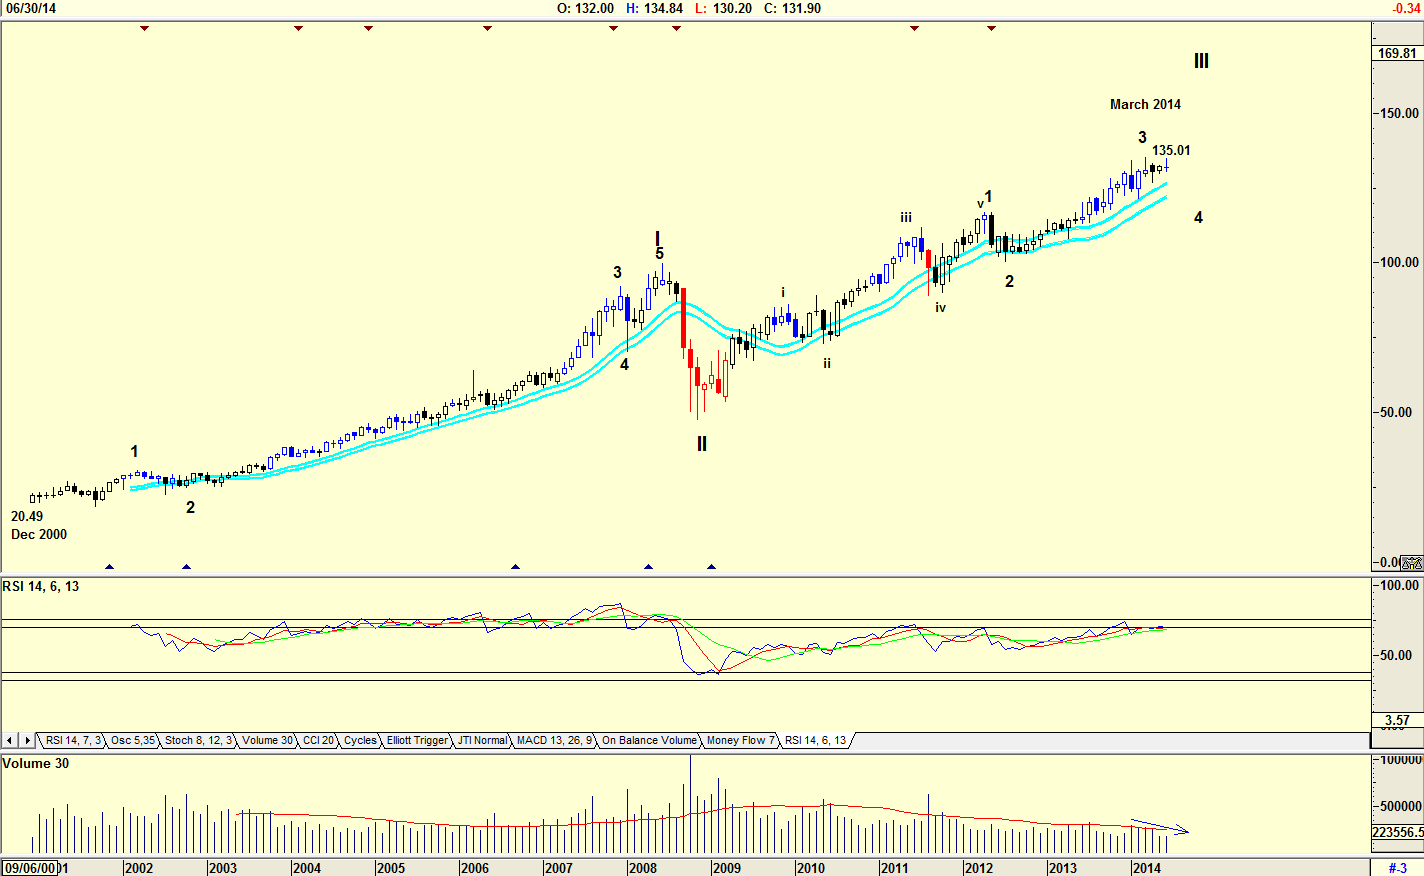
| Figure 1. Monthly chart with a suggested Elliott Wave count. |
| Graphic provided by: AdvancedGET. |
| |
| The chart in Figure 1 is a monthly chart and shows how the price has risen from a low of $20.49 in December 2000 to a high of $135.01 in March 2014. The Elliott Wave count is suggesting that the share price is tracing a major WAVE III and that it is presently completing a Wave 3 of WAVE III. This is confirmed by the Relative Strength Index (RSI) which is at overbought and is suggesting a sell. Volume has fallen over the last three months as the share price moved sideways — a sign of weakness. |

|
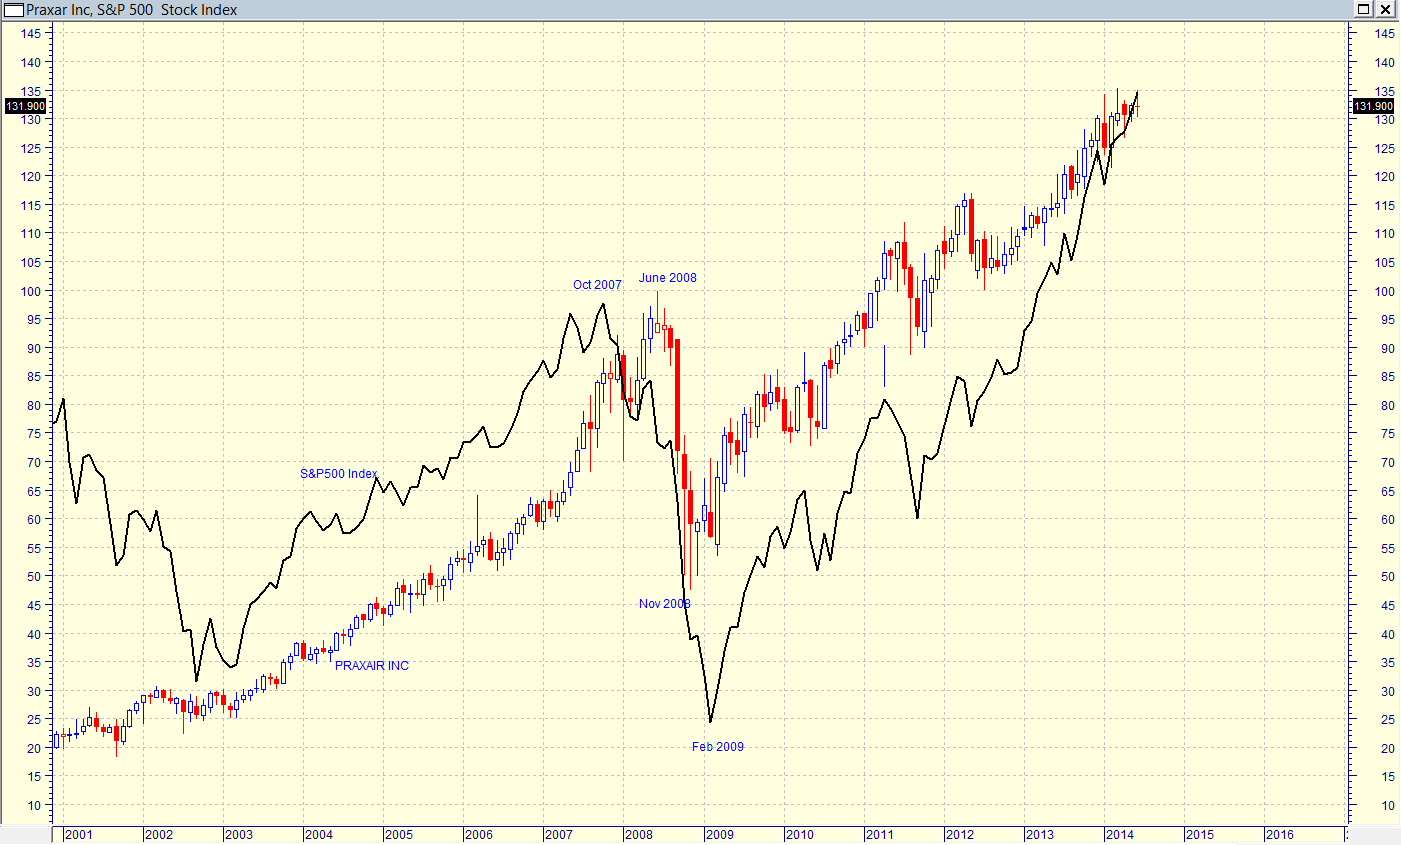
| Figure 2. Monthly chart comparing the movement of Praxair to the S&P 500 index. |
| Graphic provided by: MetaStock. |
| |
| The chart in Figure 2 is a monthly chart showing how the share price performed relative to the S&P 500 index. Note how the S&P 500 index started correcting in October 2007 whereas the price of PX only started correcting in June 2008. The correction was not as great as the S&P 500 index and the share price started recovering in November 2008 whereas the S&P 500 index only started recovering in February 2009. |

|
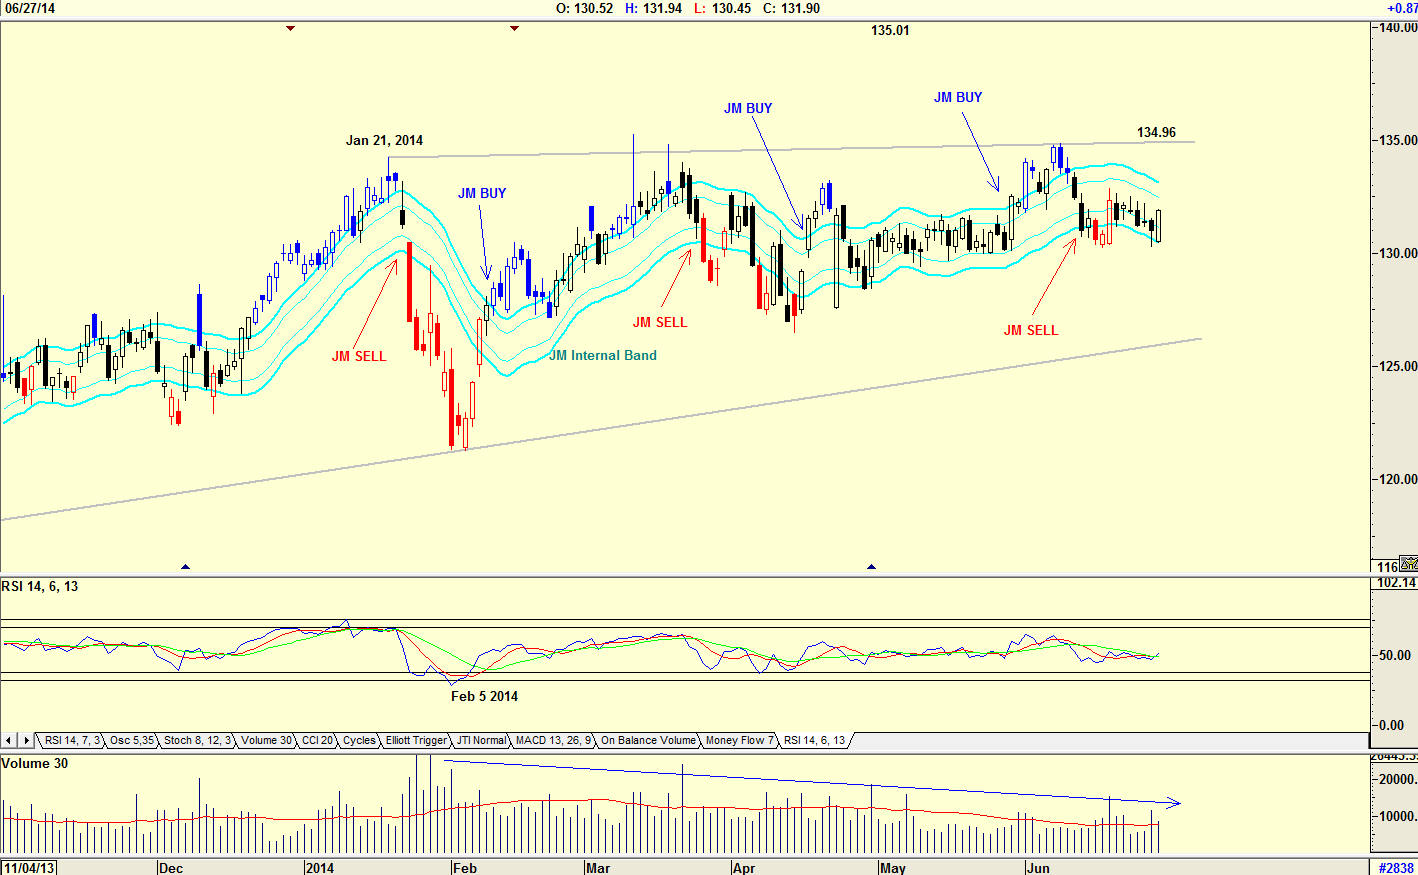
| Figure 3. Daily chart showing JM Internal Band Indicator. |
| Graphic provided by: AdvancedGET. |
| |
| The chart in Figure 3 is a daily chart showing how the share price has been moving sideways since January 21, 2014, with $134.96 being the upper resistance level. The JM Internal Band indicator is still a sell. The JM Internal Band indicator is a simple 15-period moving average offset by 2% positive and 2% negative. A move above the upper band is a buy and a move below the lower band is a sell. The RSI gave a buy signal on February 5, 2014 and has been moving sideways. The chart shows how volume has slowly decreased since that date. This is a share that is on my watch list, and I will buy and hold it should the price give a JM Internal Band buy signal or break above $134.96, the resistance level. For a long-term hold, history has shown that you can use the movement of the S&P 500 index as a trigger to exit a long term position, as the share price tends to top out after the index. |
Has been a technical analyst since 1969, and has worked as a futures and options trader with First Financial Futures in Johannesburg, South Africa.
| Address: | 3256 West 24th Ave |
| Vancouver, BC | |
| Phone # for sales: | 6042634214 |
| E-mail address: | petroosp@gmail.com |
Click here for more information about our publications!
PRINT THIS ARTICLE

Request Information From Our Sponsors
- StockCharts.com, Inc.
- Candle Patterns
- Candlestick Charting Explained
- Intermarket Technical Analysis
- John Murphy on Chart Analysis
- John Murphy's Chart Pattern Recognition
- John Murphy's Market Message
- MurphyExplainsMarketAnalysis-Intermarket Analysis
- MurphyExplainsMarketAnalysis-Visual Analysis
- StockCharts.com
- Technical Analysis of the Financial Markets
- The Visual Investor
- VectorVest, Inc.
- Executive Premier Workshop
- One-Day Options Course
- OptionsPro
- Retirement Income Workshop
- Sure-Fire Trading Systems (VectorVest, Inc.)
- Trading as a Business Workshop
- VectorVest 7 EOD
- VectorVest 7 RealTime/IntraDay
- VectorVest AutoTester
- VectorVest Educational Services
- VectorVest OnLine
- VectorVest Options Analyzer
- VectorVest ProGraphics v6.0
- VectorVest ProTrader 7
- VectorVest RealTime Derby Tool
- VectorVest Simulator
- VectorVest Variator
- VectorVest Watchdog
