HOT TOPICS LIST
- MACD
- Fibonacci
- RSI
- Gann
- ADXR
- Stochastics
- Volume
- Triangles
- Futures
- Cycles
- Volatility
- ZIGZAG
- MESA
- Retracement
- Aroon
INDICATORS LIST
LIST OF TOPICS
PRINT THIS ARTICLE
by Billy Williams
Chipotle Mexican Grill has been on a roller coaster ride in recent years but is poised to hit a big profit target.
Position: Buy
Billy Williams
Billy Williams has been trading the markets for 27 years, specializing in momentum trading with stocks and options.
PRINT THIS ARTICLE
FIBONACCI
CMG Ready To Hit Profit Target
07/02/14 05:38:03 PMby Billy Williams
Chipotle Mexican Grill has been on a roller coaster ride in recent years but is poised to hit a big profit target.
Position: Buy
| Chipotle Mexican Grill (CMG) is a great business story about a company that is bringing good food to its customers and making its shareholders wealthy in the process. The company's stock has been firing upwards like a rocket but has stumbled recently. As a result, many traders have forgotten the stock but a closer look at CMG's price action reveals that the company is headed higher again. CMG ran hot and cold at its initial public offering (IPO) in 2006 where it had a promising start but then fell apart, retracing 100% of its initial price move. Later, it found support which helped it bounce back up, but if you were smart you would have ignored the stock until it "proved" itself. A 100% retracement of an initial run is a danger sign especially in a stock that had a recent IPO. New IPOs are tricky and regardless of how the pundits hype a stock, new IPO's rarely work out in the beginning. And, after a 100% retracement, you have to let a stock prove itself by gaining back lost ground to at least 80% of the decline. |

|
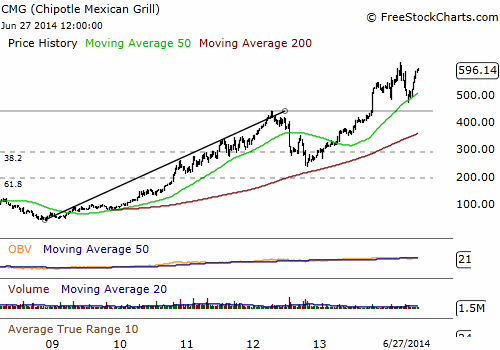
| Figure 1. Chipotle Mexican Grill (CMG) had a big bull run worth almost 400 points but then experienced a correction that saw the stock almost cut in half from its price high of $441. |
| Graphic provided by: www.freestockcharts.com. |
| |
| If a stock gains back 80% of the ground it recently lost then it shows you that price action still has some teeth behind its bite and that it is strong enough to make another go of it. In CMG's case, the stock powered back within firing range of its previous price high which set the stage for a long entry around the $155 price point. From this buy point, you saw the stock trend to $441, more than doubling in price and logging a 184% return inside of 19 months. But CMG fell on hard times in April 2012 as the stock's trend gave way to a correction. After the stock achieved a new price high at $441, it then promptly fell apart and gave up 40% of its value as it lost 190 points during a correction. |

|
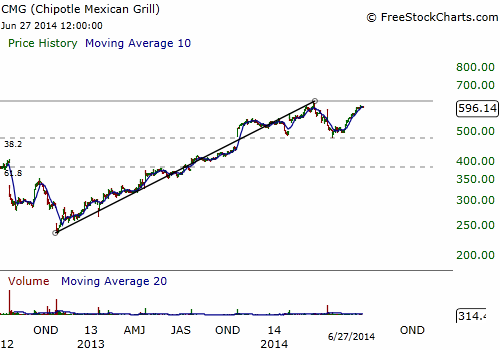
| Figure 2. CMG found support at $250 and then traded higher, gaining back lost ground and breaking higher. The stock has now retraced back to its .382 Fib level indicating that it will retest its new high of $613. |
| Graphic provided by: www.freestockcharts.com. |
| |
| Again, taking into account the previous bull run from $39 to $441, using Fibonacci retracement levels, CMG's price decline traded down to the .382 Fib level and found some measure of support. The support at this level indicated that the stock would likely trade back to $441 and possibly beyond it. Using the 402-point difference from the high of the previous bull run ($441 minus $39, you would add that to the new low at $250 to get a $652 profit target. Now, to clarify, that doesn't mean you would be expected to buy at the $250 level automatically. Once more, the stock has to "prove" itself by climbing higher. The $652 profit target is an arbitrary target to use as a reference. If you were to take an entry you would still trail your targets like any other trade but either tighten the stops as it approaches the target or take profits entirely. |

|
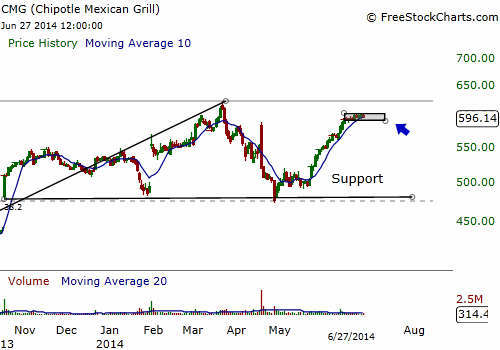
| Figure 3. Price is trading in a tight range which could offer a low-risk entry at $603. However, there is a profit target at $652 lying overhead that was set by the bigger time frame that you need to prepare for. |
| Graphic provided by: www.freestockcharts.com. |
| |
| So, after price bottomed at around $250, it began the slow ascent to higher ground, setting higher highs and higher lows in its price action along the way. As it retraced 80% of the previous decline back in the direction of the bulls, the odds were greater than 80% that it would retest its previous high at $441 which it did. After peaking above the $441 price level on October 14, 2013, CMG exploded higher on October 18, 2013 on a price gap of more than 40 points. Volume was almost 500% of its 20-day average and helped fuel the move into higher territory. |
| Later, price settled into a period of contraction by forming a trading range with support around the $480 level and a new price high of $613. Like before, price retraced 80% of its previous decline and the odds favor another retest of the previous price high, this time at the $613 level. Price is trading in a tight range over the last few days and a long entry over the $603 level looks attractive. However, keep in mind that the big price target of $652 is just overhead. While the trade looks like a low-risk setup for a 10% gain, it might be wise to take partial profits with half your position at $652 and then trail the rest in the hopes that there might be more power to the upside. Or, use call options for a quick pop and to maximize leverage while offering a large degree of risk control. |
Billy Williams has been trading the markets for 27 years, specializing in momentum trading with stocks and options.
| Company: | StockOptionSystem.com |
| E-mail address: | stockoptionsystem.com@gmail.com |
Traders' Resource Links | |
| StockOptionSystem.com has not added any product or service information to TRADERS' RESOURCE. | |
Click here for more information about our publications!
PRINT THIS ARTICLE

Request Information From Our Sponsors
- VectorVest, Inc.
- Executive Premier Workshop
- One-Day Options Course
- OptionsPro
- Retirement Income Workshop
- Sure-Fire Trading Systems (VectorVest, Inc.)
- Trading as a Business Workshop
- VectorVest 7 EOD
- VectorVest 7 RealTime/IntraDay
- VectorVest AutoTester
- VectorVest Educational Services
- VectorVest OnLine
- VectorVest Options Analyzer
- VectorVest ProGraphics v6.0
- VectorVest ProTrader 7
- VectorVest RealTime Derby Tool
- VectorVest Simulator
- VectorVest Variator
- VectorVest Watchdog
- StockCharts.com, Inc.
- Candle Patterns
- Candlestick Charting Explained
- Intermarket Technical Analysis
- John Murphy on Chart Analysis
- John Murphy's Chart Pattern Recognition
- John Murphy's Market Message
- MurphyExplainsMarketAnalysis-Intermarket Analysis
- MurphyExplainsMarketAnalysis-Visual Analysis
- StockCharts.com
- Technical Analysis of the Financial Markets
- The Visual Investor
