

HOT TOPICS LIST
- MACD
- Fibonacci
- RSI
- Gann
- ADXR
- Stochastics
- Volume
- Triangles
- Futures
- Cycles
- Volatility
- ZIGZAG
- MESA
- Retracement
- Aroon
INDICATORS LIST
LIST OF TOPICS
PRINT THIS ARTICLE
by Donald W. Pendergast, Jr.
Shares of Micron Technology (MU) are up sharply since October 2012 but may be ready for a proportional correction as money flows wane.
Position: N/A
Donald W. Pendergast, Jr.
Freelance financial markets writer and online publisher of the Trendzetterz.com S&P 500 Weekly Forecast service.
PRINT THIS ARTICLE
KELTNER CHANNELS
Micron Technology: Distribution At Multiple Degrees
07/01/14 06:27:03 PMby Donald W. Pendergast, Jr.
Shares of Micron Technology (MU) are up sharply since October 2012 but may be ready for a proportional correction as money flows wane.
Position: N/A
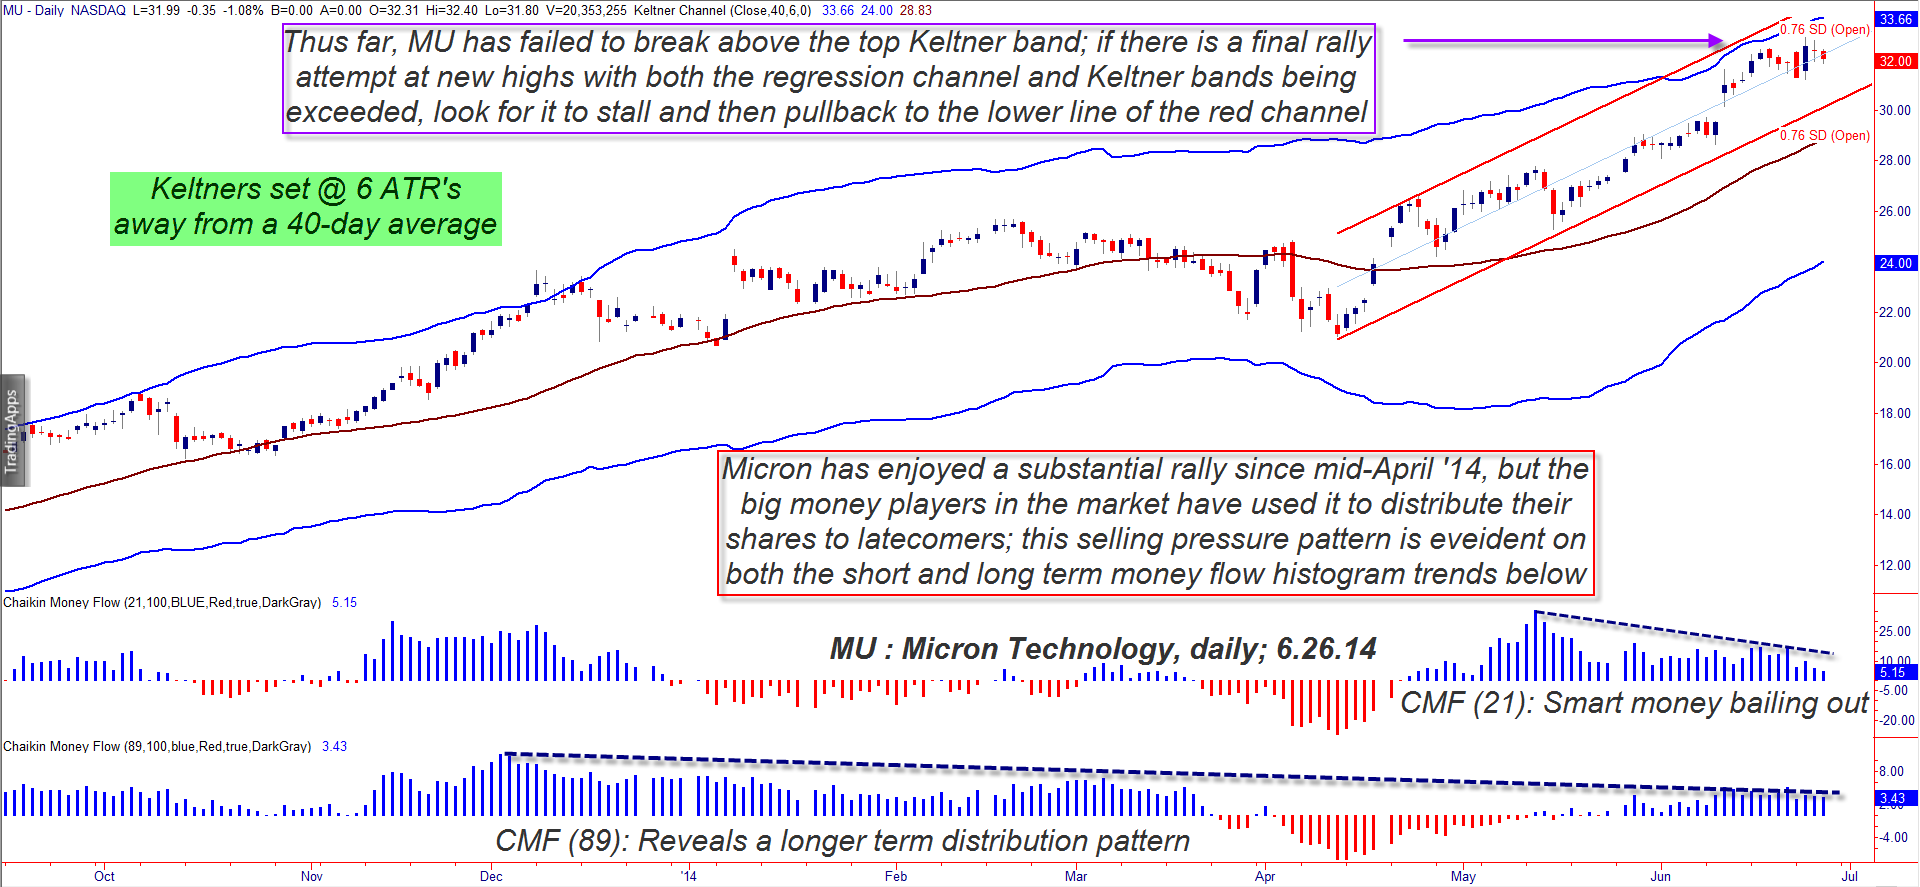
| It's foolish — and perhaps dangerous — to attempt to call a top in a large cap stock that has seen gains of 539% over the past 20 months, but it's still wise to be aware of significant money flow distribution and statistically meaningful resistance levels after a stock like Micron Technology (MU) rises in so dramatic a fashion. Here's a closer look at those dynamics at work on MU's daily chart (Figure 1). |
|
| Figure 1. Micron Technology (MU). Despite a 56% rally since April 11, 2014 MU has failed to reach its upper Keltner band again; with distribution underway on two degrees of trend, existing longs need to protect open gains aggressively. |
| Graphic provided by: TradeStation. |
| |
| MU's latest 10-week rally is rooted in the April 11, 2014 cycle low at 21.02; this is the starting point for the red linear regression channel (set at .76 standard deviations) that is still containing all of the uptrend still in progress. MU is also getting close to its upper Keltner band (set at six average true ranges away from a 40-day average), thus proving the general strength of the rally. However, there is more to the picture, such as: 1. Long-term Chaikin Money flows (CMF)(89) have been in distribution mode since December 2013. 2. Short-term money flows have also been in distribution mode since mid-May 2014. 3. Despite a gain of better than 56% in just the past 10 weeks, MU is still shy of its top Keltner band, suggesting a loss of upward momentum. All together, these dynamics are working together to warn astute traders that MU is likely to see a correction in the near future; the "smart money" has been selling their long positions to latecomers during the latest rally (as they always do, just before a substantial decline in a given stock) and existing longs need to protect their open gains with protective puts, trailing stops and perhaps by taking partial profits, too. When a great bullish trend finally does reverse, it can happen very quickly and with great volatility, so be sure you've got at least some protection in place if you're long this stock now. |
|
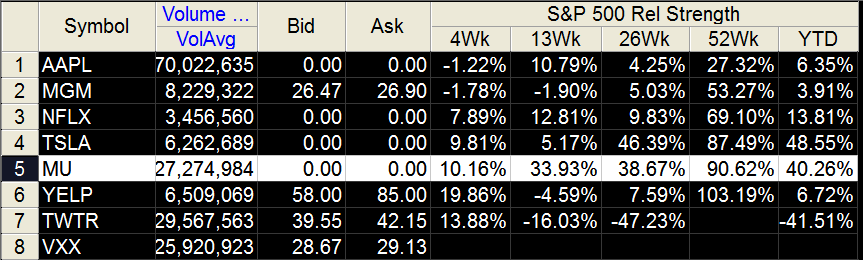
| Figure 2. MU has been a stellar outperformer within the S&P 500 (.SPX, SPY) universe of stocks over the past year. |
| Graphic provided by: TradeStation. |
| Graphic provided by: TradeStation RadarScreen. |
| |
| Be wary of any break higher above the red channel or the Keltner band, especially when such distribution patterns are evident; if MU does pullback soon, look to see if the CMF(89) histogram remains blue on a touch of the lower red channel or the Keltner midline, as that could be a place to see a minor rebound before a bigger correction ensues. Trade wisely until we meet here again. |
Freelance financial markets writer and online publisher of the Trendzetterz.com S&P 500 Weekly Forecast service.
| Title: | Market consultant and writer |
| Company: | Trendzetterz |
| Address: | 81 Hickory Hollow Drive |
| Crossville, TN 38555 | |
| Phone # for sales: | 904-303-4814 |
| Website: | trendzetterz.com |
| E-mail address: | support@trendzetterz.com |
Traders' Resource Links | |
| Trendzetterz has not added any product or service information to TRADERS' RESOURCE. | |
Click here for more information about our publications!
PRINT THIS ARTICLE

Request Information From Our Sponsors
- StockCharts.com, Inc.
- Candle Patterns
- Candlestick Charting Explained
- Intermarket Technical Analysis
- John Murphy on Chart Analysis
- John Murphy's Chart Pattern Recognition
- John Murphy's Market Message
- MurphyExplainsMarketAnalysis-Intermarket Analysis
- MurphyExplainsMarketAnalysis-Visual Analysis
- StockCharts.com
- Technical Analysis of the Financial Markets
- The Visual Investor
- VectorVest, Inc.
- Executive Premier Workshop
- One-Day Options Course
- OptionsPro
- Retirement Income Workshop
- Sure-Fire Trading Systems (VectorVest, Inc.)
- Trading as a Business Workshop
- VectorVest 7 EOD
- VectorVest 7 RealTime/IntraDay
- VectorVest AutoTester
- VectorVest Educational Services
- VectorVest OnLine
- VectorVest Options Analyzer
- VectorVest ProGraphics v6.0
- VectorVest ProTrader 7
- VectorVest RealTime Derby Tool
- VectorVest Simulator
- VectorVest Variator
- VectorVest Watchdog