HOT TOPICS LIST
- MACD
- Fibonacci
- RSI
- Gann
- ADXR
- Stochastics
- Volume
- Triangles
- Futures
- Cycles
- Volatility
- ZIGZAG
- MESA
- Retracement
- Aroon
INDICATORS LIST
LIST OF TOPICS
PRINT THIS ARTICLE
by Koos van der Merwe
Another look at a promising Canadian stock.
Position: N/A
Koos van der Merwe
Has been a technical analyst since 1969, and has worked as a futures and options trader with First Financial Futures in Johannesburg, South Africa.
PRINT THIS ARTICLE
RSI
Home Capital Group
07/01/14 06:21:11 PMby Koos van der Merwe
Another look at a promising Canadian stock.
Position: N/A
| Home Capital Group Inc. (HCG-T) is a holding company that operates through its principal subsidiary, Home Trust Company, a federally regulated trust company offering deposit, mortgage lending, retail credit, and credit card issuing services. Licensed to conduct business across Canada, Home Trust has offices in Ontario, Alberta, British Columbia, Quebec, Nova Scotia, and Manitoba. Housing prices throughout Canada have increased astronomically over the past 20 years. Americans that bought houses in the 1990s in Canada sold them in 2010 at enormous profits and returned to the US where they retired, happily. With this in mind, a look at HCG is definitely worth considering. |

|
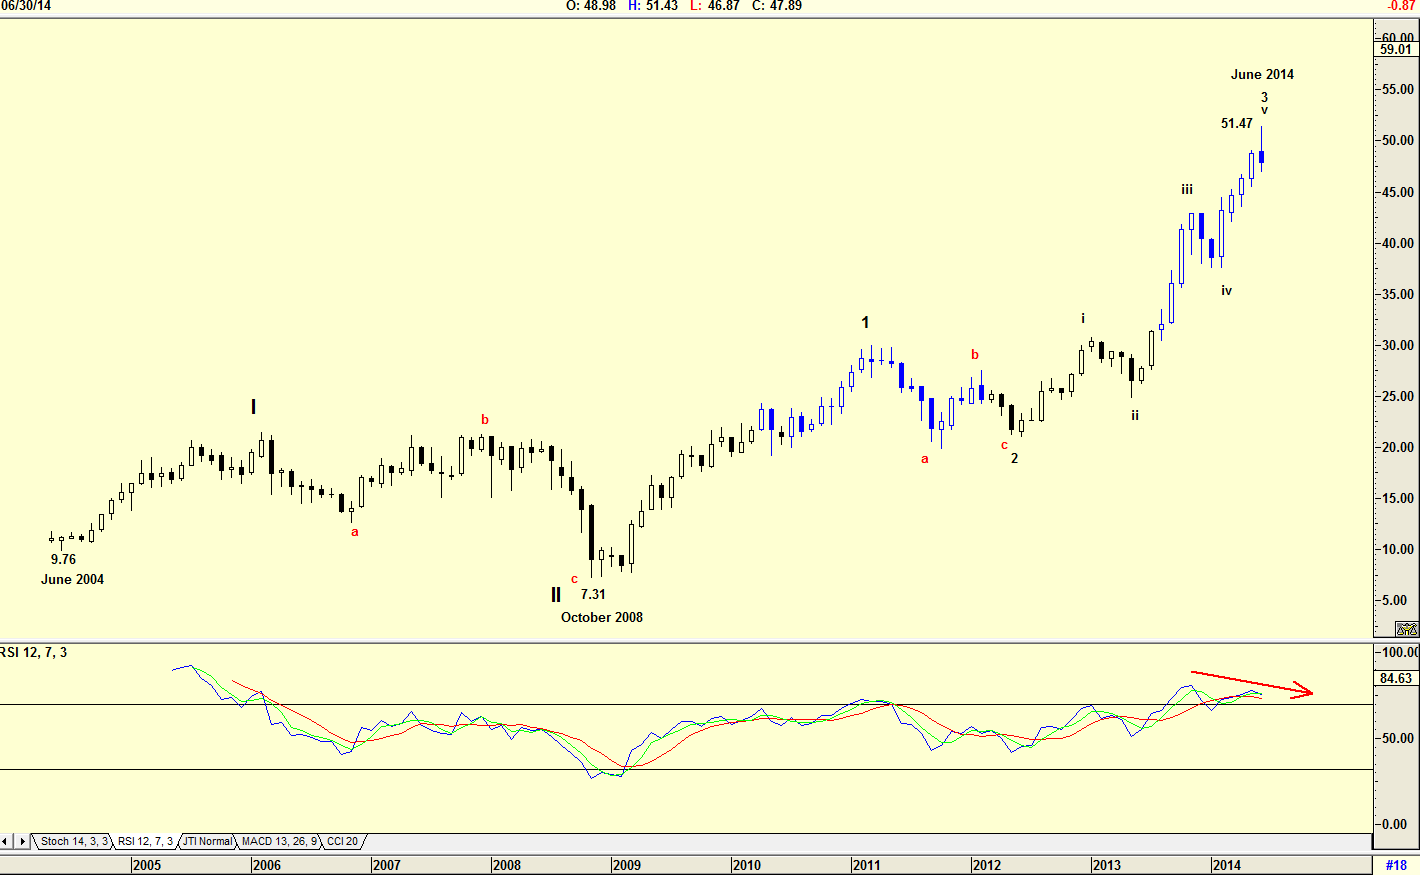
| Figure 1. Monthly chart with Elliott Wave count. |
| Graphic provided by: AdvancedGET. |
| |
| The chart in Figure 1 is a monthly chart showing how the share price rose from a low of $9.76 in June 2004 to its present price of $51.47 by June 2014. The Elliott Wave count suggests that the share price could be completing a wave 3 of WAVE III. The 12-period relative strength index (RSI) is at overbought levels, but has not given a divergence sell signal. A divergence sell signal is when the RSI makes lower highs while the share price make higher highs. |

|
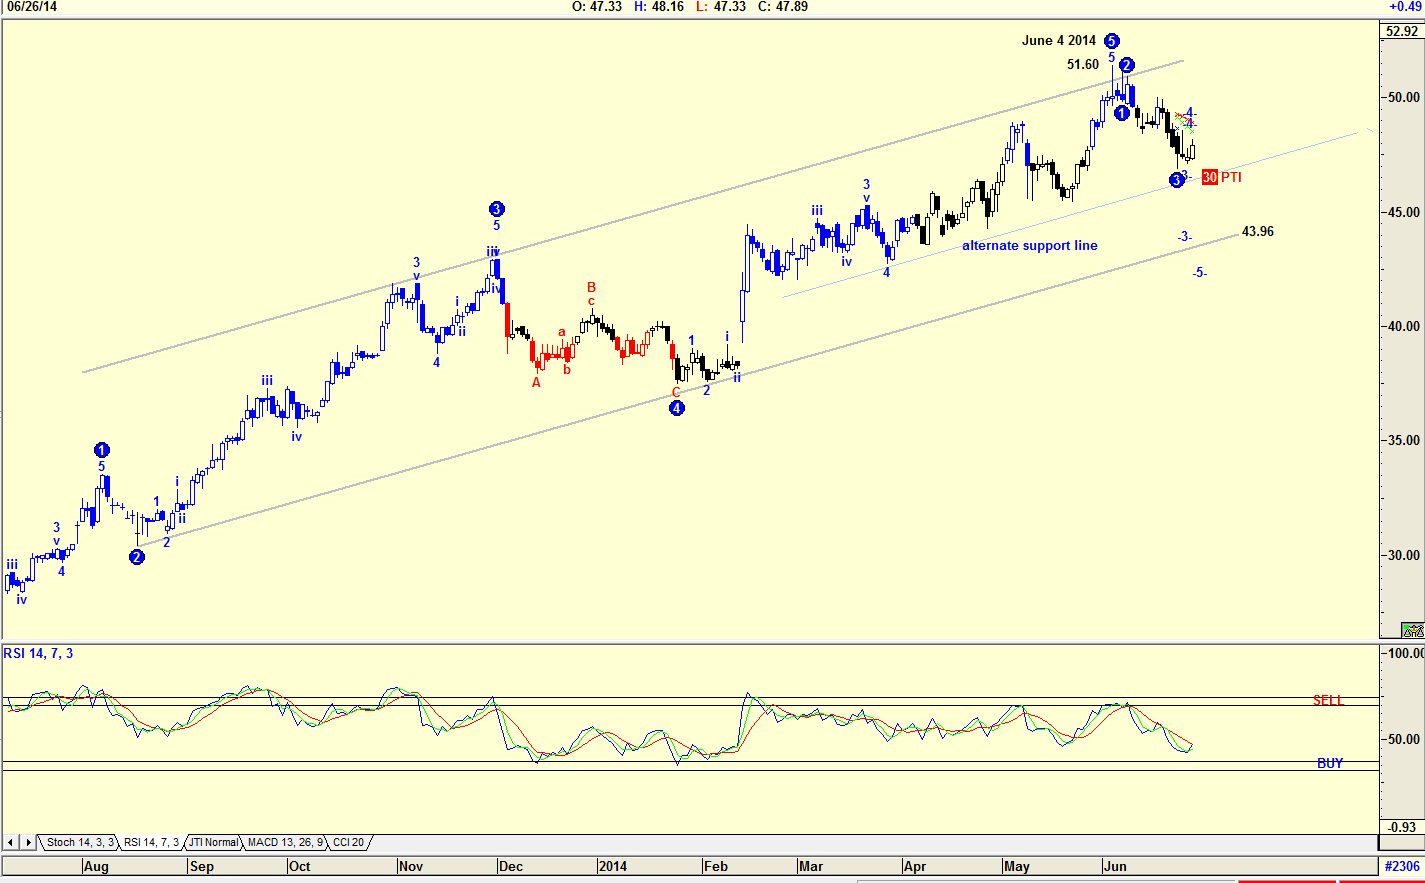
| Figure 2. Daily chart with Elliott Wave count suggesting a support level. |
| Graphic provided by: AdvancedGET. |
| |
| A daily chart in Figure 2 shows an Elliott Wave count that suggests a WAVE 5 on June 4, 2014. The RSI has given a sell signal on June 4, 2014 and the Advanced GET program is suggesting a target of $43.96 which will be in the region of the support line. The PTI of 30 (Probability Index) is low, suggesting that this price may not be reached, and that the alternate support line could be the support level. The 14-period RSI has not given a buy signal. |

|
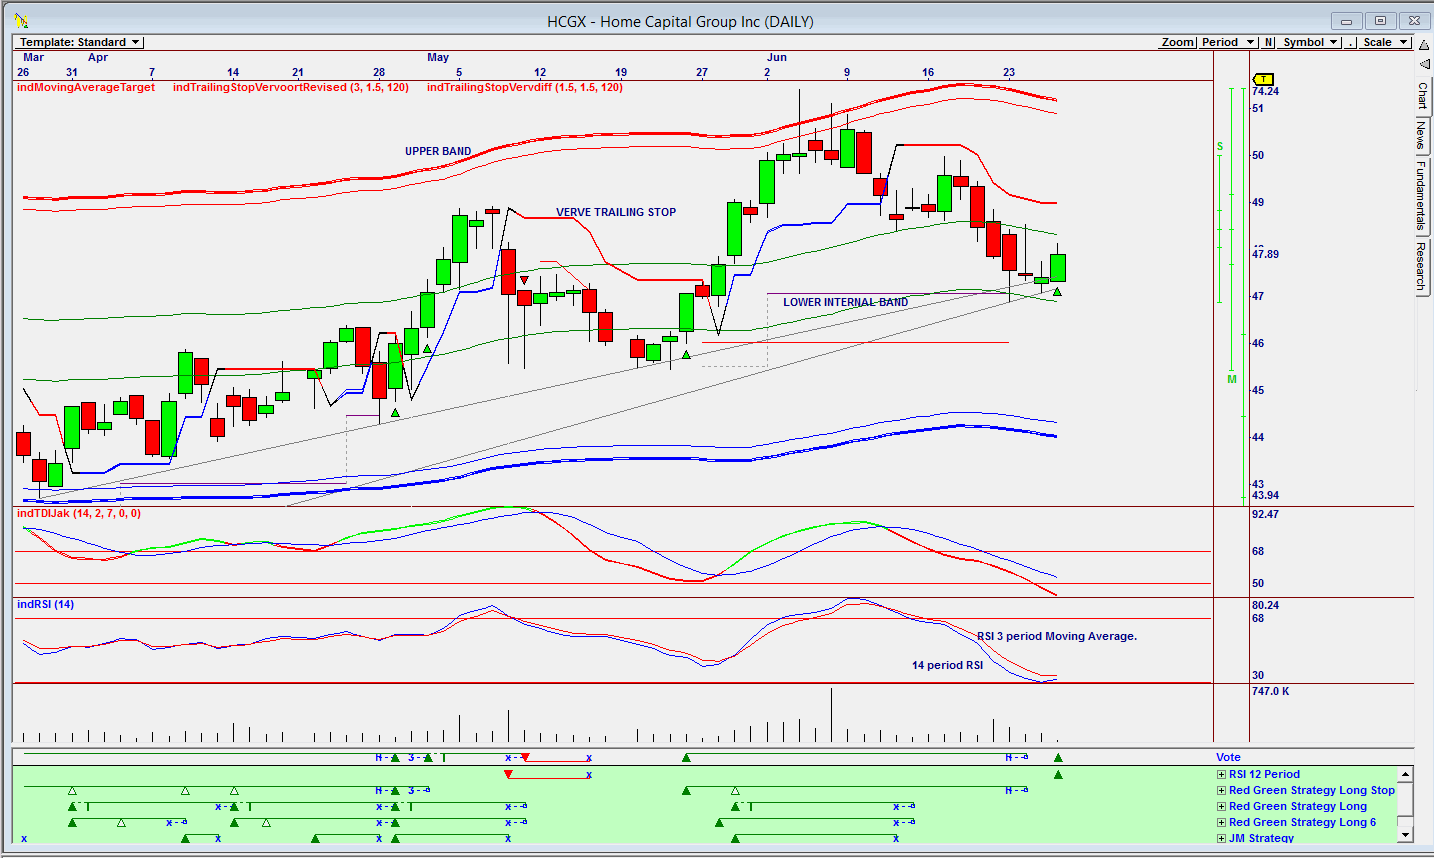
| Figure 3. Daily Omnitrader chart with Vote line suggesting a buy. |
| Graphic provided by: Omnitrader.. |
| |
| The chart in Figure 3 is an Omnitrader chart showing a Vote line buy signal based on the 12-period RSI strategy shown in green below the Vote line. Note that the 14-period RSI has not given a buy signal where it has broken above the moving average. However, the indicator has turned up suggesting a buy signal is imminent. I would be a buyer of HCG at the current price. |
Has been a technical analyst since 1969, and has worked as a futures and options trader with First Financial Futures in Johannesburg, South Africa.
| Address: | 3256 West 24th Ave |
| Vancouver, BC | |
| Phone # for sales: | 6042634214 |
| E-mail address: | petroosp@gmail.com |
Click here for more information about our publications!
PRINT THIS ARTICLE

Request Information From Our Sponsors
- StockCharts.com, Inc.
- Candle Patterns
- Candlestick Charting Explained
- Intermarket Technical Analysis
- John Murphy on Chart Analysis
- John Murphy's Chart Pattern Recognition
- John Murphy's Market Message
- MurphyExplainsMarketAnalysis-Intermarket Analysis
- MurphyExplainsMarketAnalysis-Visual Analysis
- StockCharts.com
- Technical Analysis of the Financial Markets
- The Visual Investor
- VectorVest, Inc.
- Executive Premier Workshop
- One-Day Options Course
- OptionsPro
- Retirement Income Workshop
- Sure-Fire Trading Systems (VectorVest, Inc.)
- Trading as a Business Workshop
- VectorVest 7 EOD
- VectorVest 7 RealTime/IntraDay
- VectorVest AutoTester
- VectorVest Educational Services
- VectorVest OnLine
- VectorVest Options Analyzer
- VectorVest ProGraphics v6.0
- VectorVest ProTrader 7
- VectorVest RealTime Derby Tool
- VectorVest Simulator
- VectorVest Variator
- VectorVest Watchdog
