

HOT TOPICS LIST
- MACD
- Fibonacci
- RSI
- Gann
- ADXR
- Stochastics
- Volume
- Triangles
- Futures
- Cycles
- Volatility
- ZIGZAG
- MESA
- Retracement
- Aroon
INDICATORS LIST
LIST OF TOPICS
PRINT THIS ARTICLE
by Alan R. Northam
Long-term statistical analysis shows the downward trend of the dollar weakening but may continue to move lower at a slower rate.
Position: N/A
Alan R. Northam
Alan Northam lives in the Dallas, Texas area and as an electronic engineer gave him an analytical mind from which he has developed a thorough knowledge of stock market technical analysis. His abilities to analyze the future direction of the stock market has allowed him to successfully trade of his own portfolio over the last 30 years. Mr. Northam is now retired and trading the stock market full time. You can reach him at inquiry@tradersclassroom.com or by visiting his website at http://www.tradersclassroom.com. You can also follow him on Twitter @TradersClassrm.
PRINT THIS ARTICLE
STATISTICS
A Method Of Statistical Analysis For The Dollar
06/30/14 05:13:22 PMby Alan R. Northam
Long-term statistical analysis shows the downward trend of the dollar weakening but may continue to move lower at a slower rate.
Position: N/A
| It is important to follow the dollar since its trend affects all other markets. When the dollar moves in a downward direction it puts upward pressure on interest rates. Higher interest rates, in return, ultimately cause the bond market and the stock market to move lower while the commodity market, that is, gold, moves higher. When the dollar moves in an upward trend just the opposite occurs. The affect of the dollar's trend on these markets, however, are often delayed in time. There are many methods that can be used in the analysis of a trend. Trend lines can be used, moving averages can be used, the Aroon indicator can be used, just to mention a few. There are at least 20 different methods that can be used to determine the trend of a security (stock) or market index. This analysis of the dollar will use linear regression trend lines and standard deviation lines. |
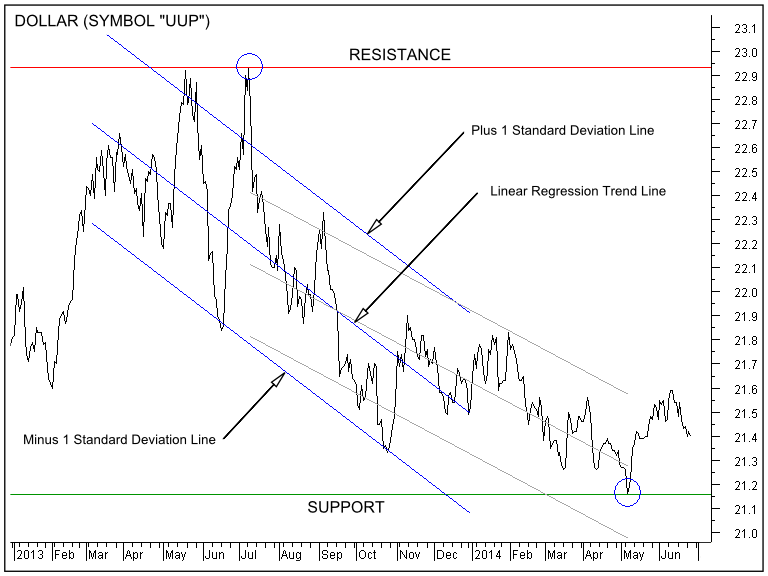
| Once a decision has been made as to what method of analysis to use in analyzing a trend, the period of time to use for the analysis must be decided. Typically a period of 200 days is used to represent the long-term trend, 50 days for the intermediate-term trend, and 20 days to represent the short-term trend. Besides these typical (standard) time frames, custom time frames can be used. In this analysis I will use a custom time frame. In this analysis I analyze the dollar over a long-term time period but I will also use a custom time frame. To determine this time frame, I will look at the highest high price and the lowest low price of the dollar over the last year. I have marked these two points with blue circles on the chart in Figure 1. I have also marked a red horizontal line for the highest high price and a green horizontal line for the lowest price. I use red for resistance and green for support. So the red horizontal line represents overhead resistance line and the green line represents support. The number of trading days between the highest high price and the lowest low price has been determined to be 210 days. |
|
| Figure 1. UUP, DAILY. This chart shows the daily price chart of the PowerShares DB US dollar index (UUP). The initial plot of the 210-day linear regression trend line and plus and minus 1 standard deviation lines are shown in light grey. The adjusted 210-day linear regression trend line and plus and minus 1 standard deviation lines to their steepest slope are shown in blue.Support and resistance Lines are also shown. |
| Graphic provided by: MetaStock. |
| Graphic provided by: Serif DrawPlus X3 (Graphic Editor). |
| |
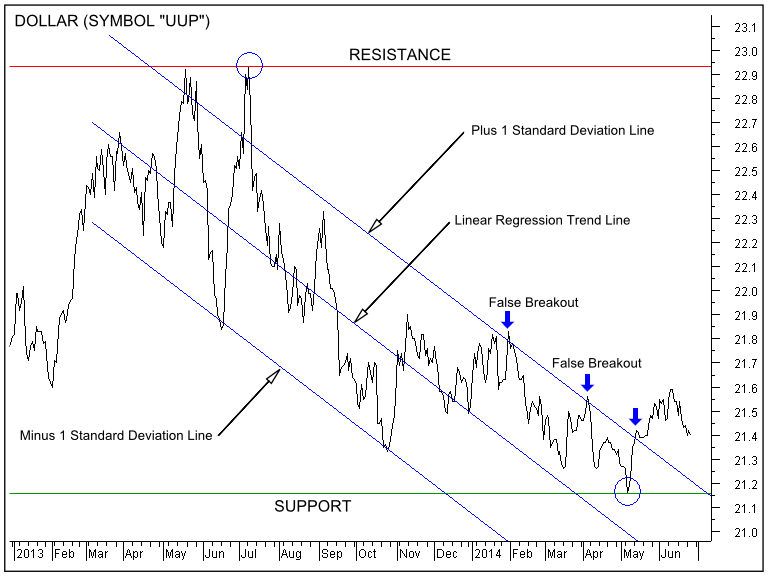
| Next, the linear regression trend line and the plus and minus 1 standard deviation lines are plotted between the highest high price and the lowest low price (grey downward sloping lines). The linear regression trend line is then moved backward and forward in time to find its steepest slope (blue lines). As can be seen on the chart in Figure 1 the steepest slope for the linear regression trend line as well as the plus and minus 1 standard deviation lines have been moved backward in time (to the left on the chart) by 87 days. Once the linear regression trend line has been adjusted to its steepest slope, the linear regression trend line and the plus and minus 1 standard deviation lines are extended forward in time as shown in Figure 2. As long as price continues to move between the plus and minus 1 standard deviation lines a strong downward trend exists. Once price breaks down below the minus 1 sigma standard deviation line (in a downward sloping trend) the trend is said to be even stronger; this condition rarely exists. A breakout above the plus 1 standard deviation line (in a downward sloping trend) indicates that the trend is starting to weaken (just the opposite exists in an upward sloping trend). Note there were two failed breakouts before the final breakout occurred. It is wise to wait for two or three closes above the plus 1 standard deviation line before declaring a true breakout to reduce risk of false breakouts. Note: Even though a breakout above the plus 1 standard deviation line is an indication of a weakening downward trend, price can, and often does, continue in a downward direction to make a final lower low price but this is not a requirement. Sometimes the downward trend will continue for quite some time but will do so at a slower pace, that is, a more shallow downward trend before reversing upward. |
|
| Figure 2. UUP, DAILY. This chart shows the daily price chart of the PowerShares DB US dollar index (UUP), along with its extended 210-day linear regression trend line and plus and minus 1 standard deviation lines. Support and resistance lines are also shown. |
| Graphic provided by: MetaStock. |
| Graphic provided by: Serif DrawPlus X3 (Graphic Editor). |
| |
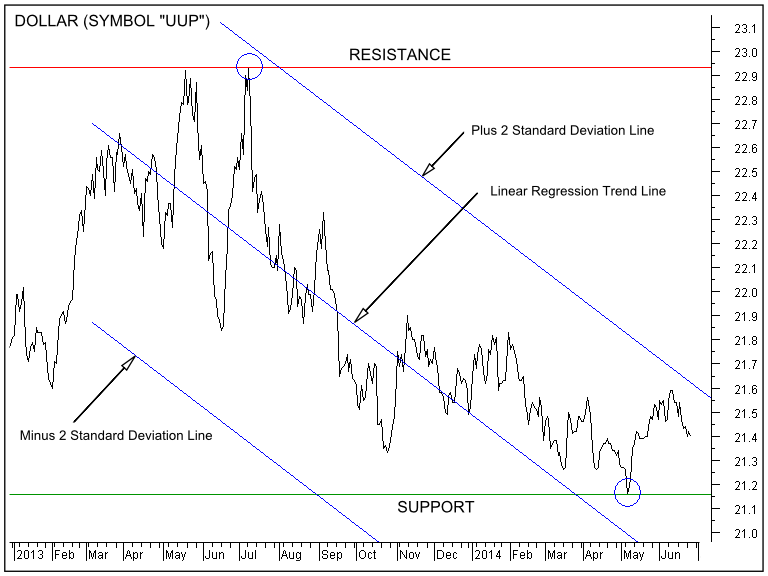
| Once price has broken out above the plus 1 standard deviation line, it is time to add the plus and minus 2 standard deviation lines as shown in Figure 3. A breakout above the plus 2 standard deviation line represents a warning that a trend reversal may occur. As long as price does not breakout above the plus 2 standard deviation line the trend will most generally continue in the downward direction. However, a breakout above the plus 2 standard deviation line is a warning that a trend reversal may be ahead. Be advised however, that a trend reversal is not a requirement after a plus 2 standard deviation line breakout as price sometimes continues to move lower. Once price breaks out above the plus 2 standard deviation line it is time to add the plus and minus 3 standard deviation lines. A breakout above the plus 3 standard deviation line represents a signal that a trend reversal is taking place. It is a rare event for price to continue to move lower after such a breakout, but as always, nothing is guaranteed. |
|
| Figure 3. UUP, DAILY. This chart shows the daily price chart of the PowerShares DB US dollar index (UUP), along with its 210-day linear regression trend line and plus and minus 2 standard deviation lines. Support and resistance lines are also shown. |
| Graphic provided by: MetaStock. |
| Graphic provided by: Serif DrawPlus X3 (Graphic Editor). |
| |
| In conclusion, the dollar has broken out above the plus 1 standard deviation line indicating a weakening downward trend. However, it is still possible for the dollar to continue to move lower at a more shallow slope. A breakout below the support line (green horizontal line) will be an indication that the dollar is continuing to move lower putting added pressure on higher interest rates and could even result in the bond market and stock market turning down. A higher low price for the dollar and a breakout above the plus 2 standard deviation line will warn of a possible reversal in the long-term trend from down to up, relieving pressure on interest rates allowing the bond market and stock market to continue higher. |
Alan Northam lives in the Dallas, Texas area and as an electronic engineer gave him an analytical mind from which he has developed a thorough knowledge of stock market technical analysis. His abilities to analyze the future direction of the stock market has allowed him to successfully trade of his own portfolio over the last 30 years. Mr. Northam is now retired and trading the stock market full time. You can reach him at inquiry@tradersclassroom.com or by visiting his website at http://www.tradersclassroom.com. You can also follow him on Twitter @TradersClassrm.
| Garland, Tx | |
| Website: | www.tradersclassroom.com |
| E-mail address: | inquiry@tradersclassroom.com |
Click here for more information about our publications!
PRINT THIS ARTICLE

Request Information From Our Sponsors
- StockCharts.com, Inc.
- Candle Patterns
- Candlestick Charting Explained
- Intermarket Technical Analysis
- John Murphy on Chart Analysis
- John Murphy's Chart Pattern Recognition
- John Murphy's Market Message
- MurphyExplainsMarketAnalysis-Intermarket Analysis
- MurphyExplainsMarketAnalysis-Visual Analysis
- StockCharts.com
- Technical Analysis of the Financial Markets
- The Visual Investor
- VectorVest, Inc.
- Executive Premier Workshop
- One-Day Options Course
- OptionsPro
- Retirement Income Workshop
- Sure-Fire Trading Systems (VectorVest, Inc.)
- Trading as a Business Workshop
- VectorVest 7 EOD
- VectorVest 7 RealTime/IntraDay
- VectorVest AutoTester
- VectorVest Educational Services
- VectorVest OnLine
- VectorVest Options Analyzer
- VectorVest ProGraphics v6.0
- VectorVest ProTrader 7
- VectorVest RealTime Derby Tool
- VectorVest Simulator
- VectorVest Variator
- VectorVest Watchdog