

HOT TOPICS LIST
- MACD
- Fibonacci
- RSI
- Gann
- ADXR
- Stochastics
- Volume
- Triangles
- Futures
- Cycles
- Volatility
- ZIGZAG
- MESA
- Retracement
- Aroon
INDICATORS LIST
LIST OF TOPICS
PRINT THIS ARTICLE
by Donald W. Pendergast, Jr.
Still trading within a bullish channel and with gains of 100% since July 2013, shares of United Rentals, Inc. may be running out of gas.
Position: N/A
Donald W. Pendergast, Jr.
Freelance financial markets writer and online publisher of the Trendzetterz.com S&P 500 Weekly Forecast service.
PRINT THIS ARTICLE
CHANNEL LINES
URI: Bullish Channel Running Out Of Gas?
06/30/14 04:59:53 PMby Donald W. Pendergast, Jr.
Still trading within a bullish channel and with gains of 100% since July 2013, shares of United Rentals, Inc. may be running out of gas.
Position: N/A
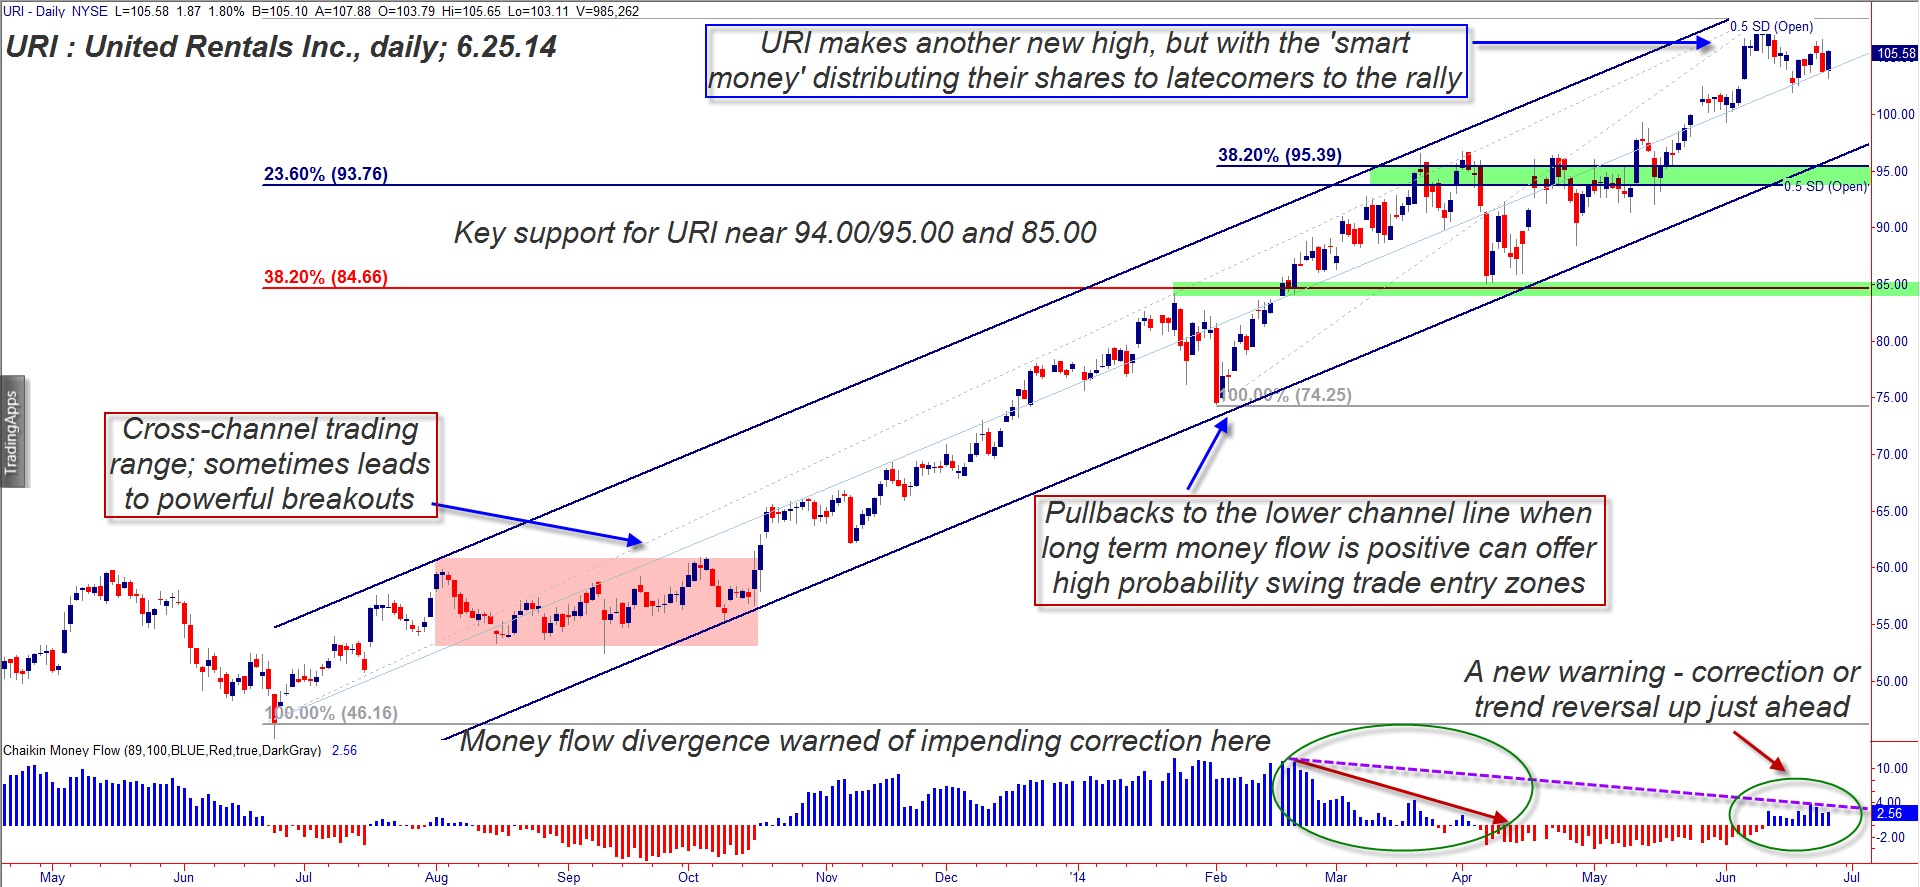
| Of all 400 stocks in the S&P 400 index (MDY), shares of United Rentals, Inc. (URI) have the fourth-best 52-week comparative relative strength ranking versus the broad markets (.SPX, SPY). The stock is still near the top end of a powerful bullish linear regression channel that is nearly one year old, still trading close to its all-time high price of 108.46, but there are two critical dynamics at work that suggest that URI's major rally is now much closer to its end than its beginning. Here's a closer look. |
|
| Figure 1. United Rentals Inc. (URI) has rallied very nicely for the past year in a low volatility uptrend; multiple bearish money flow divergences now suggest that a correction may be due soon. |
| Graphic provided by: TradeStation. |
| |
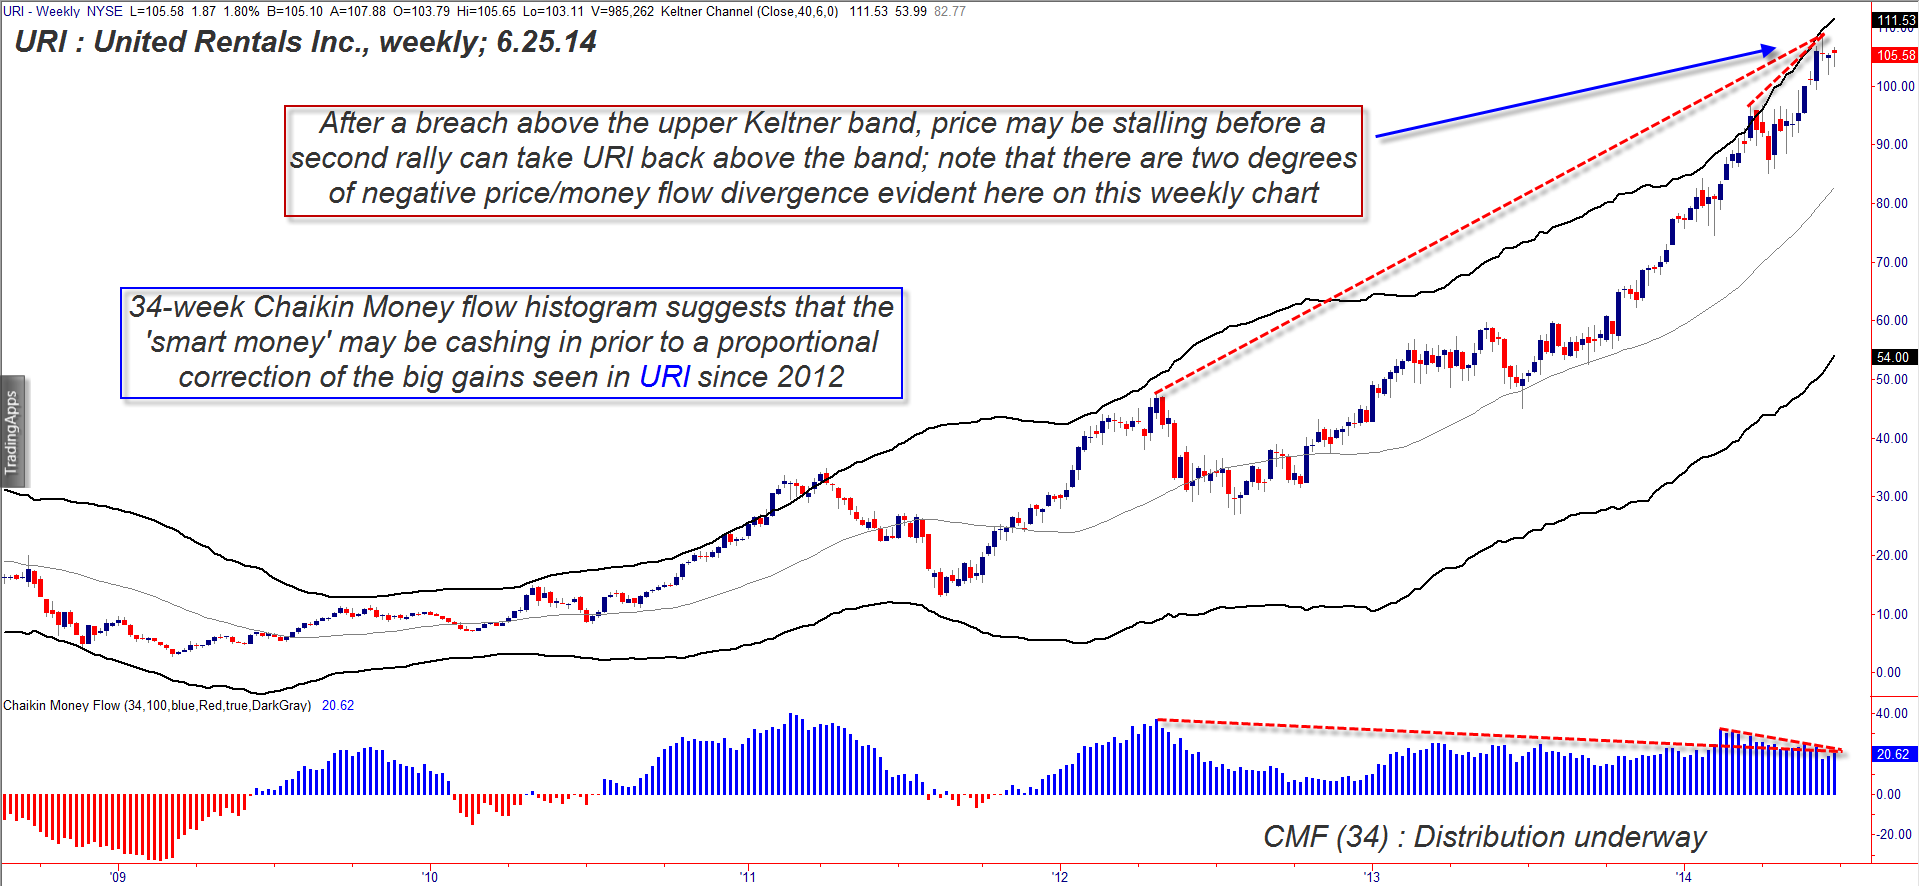
| URI's staggering rally since coming out of its June 24, 2013 low has been contained within a fairly narrow, low-volatility linear regression channel (set at .5 standard deviations) on its daily chart (Figure 1); its weekly (Figure 2) and monthly chart also confirm the stock has been in a massive multiyear bull run, one that is actually going parabolic on the monthly time frame. Eventually, the final buyer will step in and prove to be the 'greater fool' and the stock will reverse lower on multiple degrees of trend. Looking at the daily chart perhaps gives us a bit of a head start on the process, and as we do we find that URI: 1. Is still within a few dollars of its all-time high and is resting at the mid-line support of the channel. 2. Has experienced a steady deterioration in its long-term money flows since February 2014. 3. Is now barely outperforming the S&P 500 index (.SPX, SPY) over the past four- and 13-week periods, losing its upward momentum at a rapid pace. On URI's weekly chart, you also see that a negative price/money flow divergence has manifested at two distinct degrees of trend; as price has soared, the 34-week Chaikin Money Flow (CMF)(34) histogram has failed to make new highs and is now confirming long-term distribution by the big institutional players in the markets. Additionally, URI pierced the upper weekly Keltner band in late March 2014 and after a mild pullback has thus far failed to rally back up to the band. Combined with the bearish money flow divergences, this is a significant early warning of an upcoming trend reversal. |
|
| Figure 2. URI's weekly chart also reveals that the "smart money" are distributing their shares to latecomers to the massive rally. Look for a likely trend reversal before the upper band can be pierced again. |
| Graphic provided by: TradeStation. |
| |
| The big idea here for existing URI longs is simply this: A. The stock's monthly chart is now in a major parabolic ascent. B. The weekly chart suggests distribution and a correction to occur early in the second half of 2014. C. URI's daily chart is also manifesting pronounced distribution and a daily close below 101.80 establishes a new downtrend pattern of swing lows and highs; if this breakdown happens soon, the selling pressures could be strong and swift, able to quickly bring URI down to its next major support level (green shaded area) near 94.00/95.00. If/when URI reaches those pullback levels, check and see if the money flow histogram is still bullish, as that will give you some idea as whether to expect a solid relief rally or not. If the histogram has turned red (bearish) then expect a larger degree downtrend, one that may eventually find plenty of buyers down near the 85.00 level. Speculative bears may want to watch for breakdown/shorting opportunities near 94.00 if the money flow trend is still negative at that time. Keep you trade risks small and remember to trade wisely until we meet here again. |
Freelance financial markets writer and online publisher of the Trendzetterz.com S&P 500 Weekly Forecast service.
| Title: | Market consultant and writer |
| Company: | Trendzetterz |
| Address: | 81 Hickory Hollow Drive |
| Crossville, TN 38555 | |
| Phone # for sales: | 904-303-4814 |
| Website: | trendzetterz.com |
| E-mail address: | support@trendzetterz.com |
Traders' Resource Links | |
| Trendzetterz has not added any product or service information to TRADERS' RESOURCE. | |
Click here for more information about our publications!
PRINT THIS ARTICLE

Request Information From Our Sponsors
- StockCharts.com, Inc.
- Candle Patterns
- Candlestick Charting Explained
- Intermarket Technical Analysis
- John Murphy on Chart Analysis
- John Murphy's Chart Pattern Recognition
- John Murphy's Market Message
- MurphyExplainsMarketAnalysis-Intermarket Analysis
- MurphyExplainsMarketAnalysis-Visual Analysis
- StockCharts.com
- Technical Analysis of the Financial Markets
- The Visual Investor
- VectorVest, Inc.
- Executive Premier Workshop
- One-Day Options Course
- OptionsPro
- Retirement Income Workshop
- Sure-Fire Trading Systems (VectorVest, Inc.)
- Trading as a Business Workshop
- VectorVest 7 EOD
- VectorVest 7 RealTime/IntraDay
- VectorVest AutoTester
- VectorVest Educational Services
- VectorVest OnLine
- VectorVest Options Analyzer
- VectorVest ProGraphics v6.0
- VectorVest ProTrader 7
- VectorVest RealTime Derby Tool
- VectorVest Simulator
- VectorVest Variator
- VectorVest Watchdog