HOT TOPICS LIST
- MACD
- Fibonacci
- RSI
- Gann
- ADXR
- Stochastics
- Volume
- Triangles
- Futures
- Cycles
- Volatility
- ZIGZAG
- MESA
- Retracement
- Aroon
INDICATORS LIST
LIST OF TOPICS
PRINT THIS ARTICLE
by Billy Williams
Considered down-and-out at one time, IHS has powered back to leadership status and setting up for a new bull run.
Position: Buy
Billy Williams
Billy Williams has been trading the markets for 27 years, specializing in momentum trading with stocks and options.
PRINT THIS ARTICLE
FIBONACCI
IHS, Inc. - The Comeback Kid
06/27/14 04:38:15 PMby Billy Williams
Considered down-and-out at one time, IHS has powered back to leadership status and setting up for a new bull run.
Position: Buy
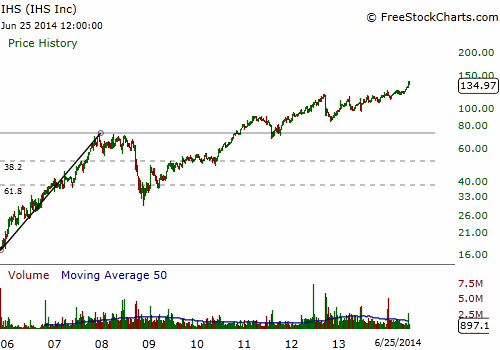
| The market has been on a strong run in recent weeks but has started to stall as of this past Friday. During the last few trading days the major indexes were showing a big rise in volume but price action didn't show any upside gains, doing little more than treading water. Trading days that open and close almost at the same level reveal "railroad tracks" forming in the price action, which is a bearish indicator. But, in this current market, that could be sign of opportunity for one stock. IHS Inc. (IHS) is an IT company that offers a wide variety of technological services to other businesses to help them track efficiencies and inefficiencies in their day-to-day operations. IHS was steadily trading higher up to the 2008 when it moved from a period of price expansion to a period of price contraction (Figure 1). In early December 2007, the bulls ran into resistance at the $70 price level, after which the trend fell down a cliff in September 2008. In late November 2008, the stock hit a significant price low at around $29 but managed to find it bottom and begin to climb its way back from the abyss. |

|
| Figure 1. IHS, Inc. (IHS) started out strong but market forces took the stock down and into a steep decline. IHS kissed the .618 Fib level but managed to power back to trade past its old price high. The surge higher shows real power behind the stock which could take it even further. |
| Graphic provided by: www.freestockcharts.com. |
| |
| What stands out about IHS during this time is that its price retraced all the way to a .618 Fib retracement level and still managed to find its legs and begin the long march back to its previous price high. When price begins to retrace the previous trend's distance, Fibonacci offers a glance inside the true meaning of that retracement. The three most common retracements are the .382, .50, and the .618. If a stock retraces to either a .382 or .50 Fib retracement then the odds suggest that there is a high likelihood that stock will recover and trade back to its former price high and/or exceed it. But, if it retraces to the .618 level, then that is a sign of weakness on part of the stock that suggests that there is a low likelihood that a stock will trade back to its former price high, much less exceed that price high. |

|
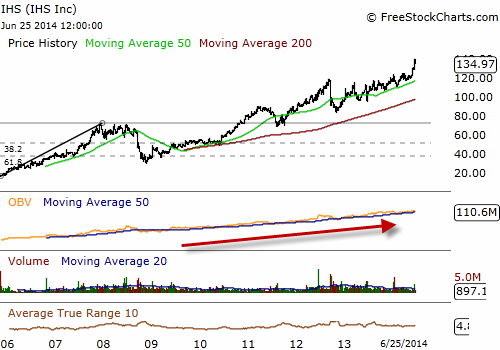
| Figure 2. The fuel behind the trend is revealed in the On Balance Volume (OBV) indicator. The steady rise in accumulation shows institutional traders are steadily buying up the stock putting the stock's movement firmly in the bull's camp. |
| Graphic provided by: www.freestockcharts.com. |
| |
| That IHS fell so far and yet managed to scrape and scramble its way back to the price point where it declined from, is worth noting. Why? Because it denotes price strength and that is the stuff trends are made of, and that is where you make your money. Moreover, IHS managed to keep trading higher after reaching that price high which is definitely a sign that institutional traders are rallying to the stock. A quick glance at the weekly chart (Figure 2) along with the On Balance Volume indicator (OBV) shows that volume has been steadily pouring into the stock. This volume is fueling the stock's price movement and, until something significant changes that, IHS will likely trend higher. |

|
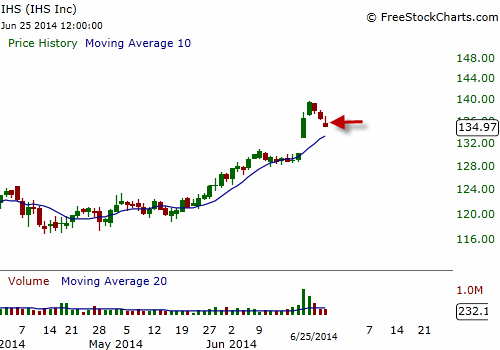
| Figure 3. The stock is pulling back with the rest of the market and may be offering a long entry in the near future. |
| Graphic provided by: www.freestockcharts.com. |
| |
| But, is now the time to enter? No. At least, not until IHS pulls back from its current high. IHS has traded beyond its upper Bollinger Band off a six point price gap from last week. The price gap opened and closed outside the previous trading day's range on much higher volume and it would be wise to let price cool off and have time to consolidate those gains before entering too soon. Price could easily drift and/or fall apart to close the price gap lying below its trading range. Price is pulling back (Figure 3) the same as the overall market which offers two possibilities for entry: 1. Enter as price trades higher than the previous bearish bar. 2. As price consolidates and then trades above the previous price high and enter around the $140 level. Till then, adopt a wait-and-see approach. Upon entry, set your stop loss no higher than 7% from your entry point and your risk exposure no more than 2% of your total trade equity. |
Billy Williams has been trading the markets for 27 years, specializing in momentum trading with stocks and options.
| Company: | StockOptionSystem.com |
| E-mail address: | stockoptionsystem.com@gmail.com |
Traders' Resource Links | |
| StockOptionSystem.com has not added any product or service information to TRADERS' RESOURCE. | |
Click here for more information about our publications!
PRINT THIS ARTICLE

|

Request Information From Our Sponsors
- VectorVest, Inc.
- Executive Premier Workshop
- One-Day Options Course
- OptionsPro
- Retirement Income Workshop
- Sure-Fire Trading Systems (VectorVest, Inc.)
- Trading as a Business Workshop
- VectorVest 7 EOD
- VectorVest 7 RealTime/IntraDay
- VectorVest AutoTester
- VectorVest Educational Services
- VectorVest OnLine
- VectorVest Options Analyzer
- VectorVest ProGraphics v6.0
- VectorVest ProTrader 7
- VectorVest RealTime Derby Tool
- VectorVest Simulator
- VectorVest Variator
- VectorVest Watchdog
- StockCharts.com, Inc.
- Candle Patterns
- Candlestick Charting Explained
- Intermarket Technical Analysis
- John Murphy on Chart Analysis
- John Murphy's Chart Pattern Recognition
- John Murphy's Market Message
- MurphyExplainsMarketAnalysis-Intermarket Analysis
- MurphyExplainsMarketAnalysis-Visual Analysis
- StockCharts.com
- Technical Analysis of the Financial Markets
- The Visual Investor
