

HOT TOPICS LIST
- MACD
- Fibonacci
- RSI
- Gann
- ADXR
- Stochastics
- Volume
- Triangles
- Futures
- Cycles
- Volatility
- ZIGZAG
- MESA
- Retracement
- Aroon
INDICATORS LIST
LIST OF TOPICS
PRINT THIS ARTICLE
by Donald W. Pendergast, Jr.
With the latest leg of a six month long downtrend finally ending, shares of American Eagle Outfitters may be on the verge of a bullish trend reversal.
Position: N/A
Donald W. Pendergast, Jr.
Freelance financial markets writer and online publisher of the Trendzetterz.com S&P 500 Weekly Forecast service.
PRINT THIS ARTICLE
REVERSAL
AEO: Bullish Trend Reversal?
06/26/14 04:27:30 PMby Donald W. Pendergast, Jr.
With the latest leg of a six month long downtrend finally ending, shares of American Eagle Outfitters may be on the verge of a bullish trend reversal.
Position: N/A
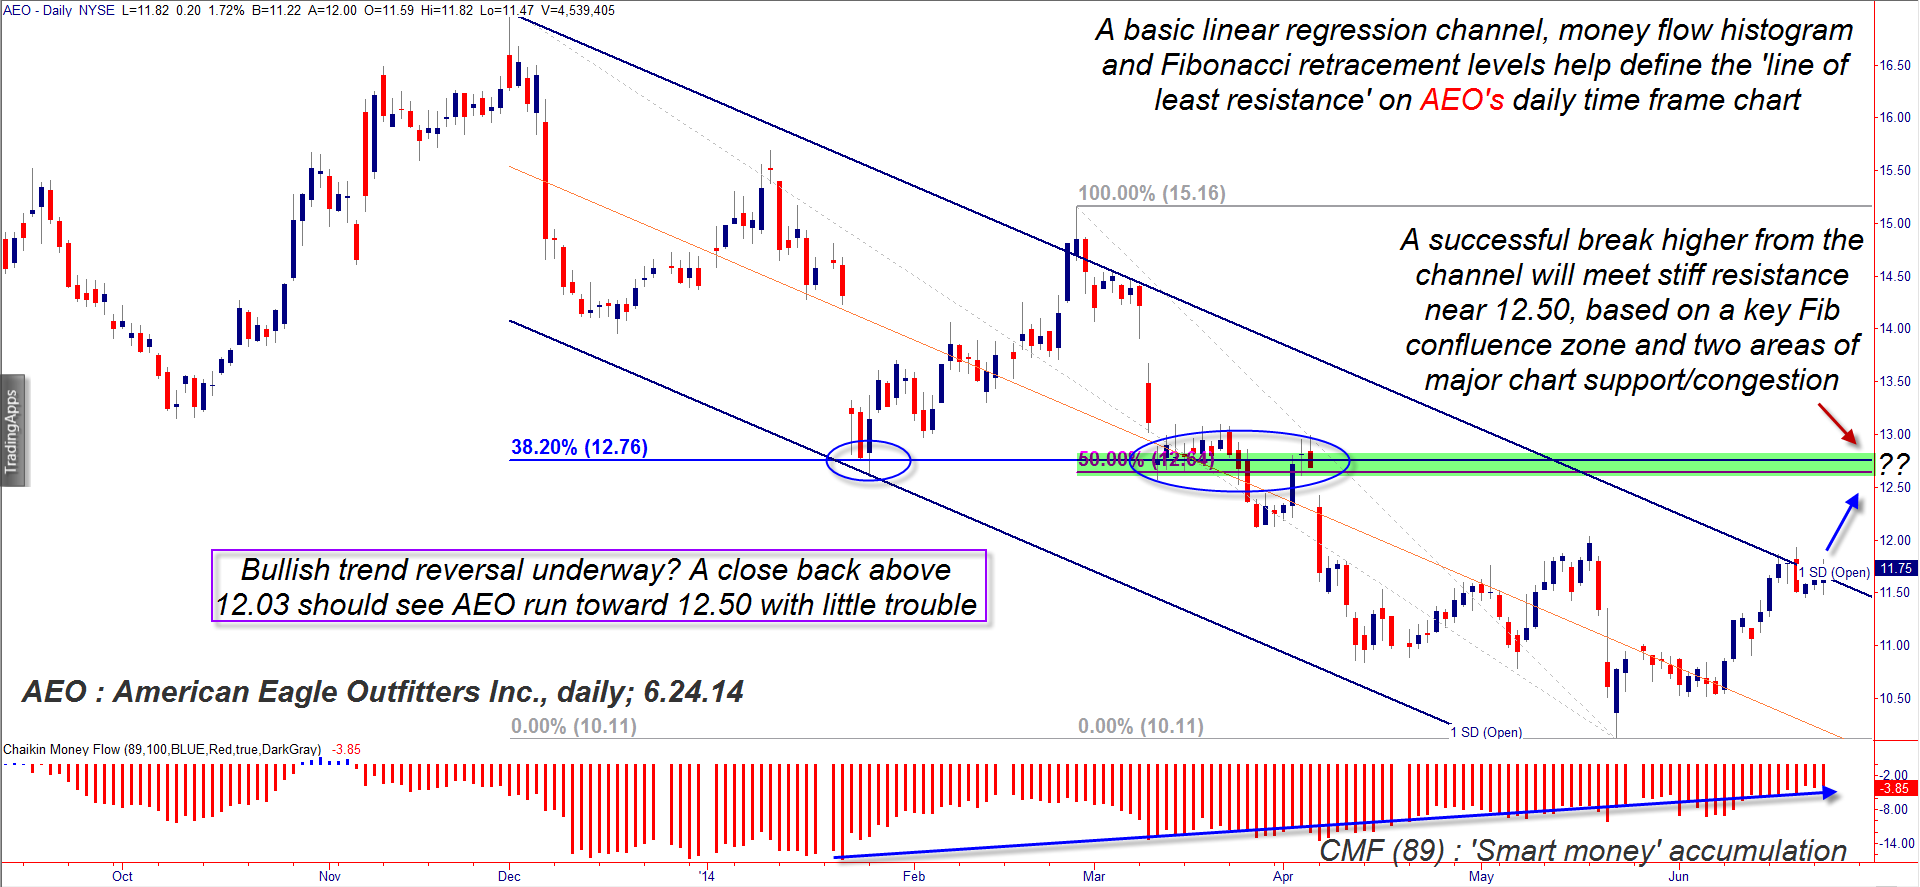
| Shares of American Eagle Outfitters (AEO) declined by as much as 56% between October 18, 2012 and May 22, 2014 and have also spent most of the past six months trading within a bearish linear regression channel. It's been a persistently bearish period for the stock since late 2012, but some signs of life are now manifesting that should make it easy for savvy swing, covered call, and put sellers to make some money in the near term as AEO attempts to regain lost ground. Here's a closer look. |
|
| Figure 1. American Eagle Outfitters Inc. (AEO): With a bullish price/money flow reversal already confirmed, all AEO bulls need now is a break above the 11.93 and 12.03 swing highs to get a fast run up toward the key resistance zone near 12.65/12.76. |
| Graphic provided by: TradeStation. |
| |
| There isn't anything magical about the use of linear regression channels; you need to use some discretion when applying them to a given data series on a chart in order to arrive at a logical best fit, using your eyes to note the trend worthiness if the pattern of swing highs/swing lows lies within the channel. With practice however, you can learn to use such channels to identify high probability trend reversal situations, and that's what we'll try to do here as we analyze AEO's daily chart in Figure 1. The regression channel is set at one standard deviation and is rooted in the December 2, 2013 swing high and the May 22, 2014 swing low and manages to capture most of the trading action since early December 2013. Once a well-established channel is violated (in either direction) by a stock, you may be witnessing the start of a tradable reversal; here's what to look for in AEO in the days and weeks ahead: 1. If/when AEO can close back above 11.93 and then 12.03, the next major resistance zone comes in near 12.65, allowing for a good chance of a five to six percent bullish swing move. 2. The long-term Chaikin Money Flow histogram (CMF)(89) is close to going positive for the first time in 7.5 months and also confirms that big institutions have been busily accumulating shares of AEO since late January 2014. This is a classic trend reversal setup, one that has a high probability of near-term (and possibly longer-term) success, but there are two factors to keep in mind if you jump on board if/when the stock clears 11.93/12.03: A. The quarterly earnings trend has been bearish for AEO since May '13. B. The resistance zone between 12.65/12.76 is formidable, and should see plenty of profit-taking if arrived at soon. |
|
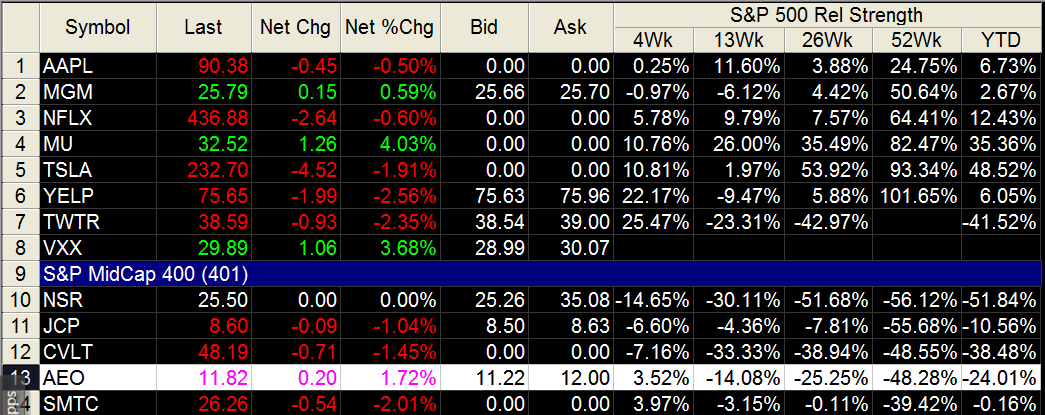
| Figure 2. AEO has exceptionally poor relative strength against the S&P 500 index (.SPX, SPY) over longer time periods, but is beginning to outperform over the last four weeks. |
| Graphic provided by: TradeStation. |
| Graphic provided by: TradeStation RadarScreen. |
| |
| With that said, here are three ideas for how to play a high probability bullish run toward 12.65/12.76 in the days ahead: 1. Sell an August 2014 $11.00 AEO put option (or multiples thereof) and look to cover on a rally toward 12.65; a drop toward 11.50 or an increase of 50% in the value of the put would also be an exit signal. You can try selling the July $11.00 put instead, but the bid/ask spread is too wide to look attractive. 2. You could put on an August 2014 $11.00 covered call play, using a 21-day exponential moving average (EMA) as your trailing stop for the life of the trade; again, you can do this with the July calls at the same strike, but the bid/ask spread is poor. 3. Swing traders can put on half a position on a break above 11.93 and then another half on a break above 12.03, running a two- to three-bar trailing stop of the daily lows until final stop out; consider taking at least half (if not all) of your gains once the 12.65 resistance area is reached. As a reversal-type trade, your account risk should be limited to about 1% for this setup in AEO; trade wisely until we meet here again. |
Freelance financial markets writer and online publisher of the Trendzetterz.com S&P 500 Weekly Forecast service.
| Title: | Market consultant and writer |
| Company: | Trendzetterz |
| Address: | 81 Hickory Hollow Drive |
| Crossville, TN 38555 | |
| Phone # for sales: | 904-303-4814 |
| Website: | trendzetterz.com |
| E-mail address: | support@trendzetterz.com |
Traders' Resource Links | |
| Trendzetterz has not added any product or service information to TRADERS' RESOURCE. | |
Click here for more information about our publications!
PRINT THIS ARTICLE

Request Information From Our Sponsors
- StockCharts.com, Inc.
- Candle Patterns
- Candlestick Charting Explained
- Intermarket Technical Analysis
- John Murphy on Chart Analysis
- John Murphy's Chart Pattern Recognition
- John Murphy's Market Message
- MurphyExplainsMarketAnalysis-Intermarket Analysis
- MurphyExplainsMarketAnalysis-Visual Analysis
- StockCharts.com
- Technical Analysis of the Financial Markets
- The Visual Investor
- VectorVest, Inc.
- Executive Premier Workshop
- One-Day Options Course
- OptionsPro
- Retirement Income Workshop
- Sure-Fire Trading Systems (VectorVest, Inc.)
- Trading as a Business Workshop
- VectorVest 7 EOD
- VectorVest 7 RealTime/IntraDay
- VectorVest AutoTester
- VectorVest Educational Services
- VectorVest OnLine
- VectorVest Options Analyzer
- VectorVest ProGraphics v6.0
- VectorVest ProTrader 7
- VectorVest RealTime Derby Tool
- VectorVest Simulator
- VectorVest Variator
- VectorVest Watchdog