

HOT TOPICS LIST
- MACD
- Fibonacci
- RSI
- Gann
- ADXR
- Stochastics
- Volume
- Triangles
- Futures
- Cycles
- Volatility
- ZIGZAG
- MESA
- Retracement
- Aroon
INDICATORS LIST
LIST OF TOPICS
PRINT THIS ARTICLE
by Donald W. Pendergast, Jr.
Already up by more than 1400% in the past two years, shares of SunEdison Inc. appear to be breaking sharply higher again.
Position: N/A
Donald W. Pendergast, Jr.
Freelance financial markets writer and online publisher of the Trendzetterz.com S&P 500 Weekly Forecast service.
PRINT THIS ARTICLE
BREAKOUTS
SUNE: All Clear For More Gains?
06/25/14 04:45:23 PMby Donald W. Pendergast, Jr.
Already up by more than 1400% in the past two years, shares of SunEdison Inc. appear to be breaking sharply higher again.
Position: N/A
| Mid-cap stocks tend to make bigger trend moves than their large-cap brethren, but still it's rare to see a stock — regardless of its market cap — make a 1450% gain in just over two years. Yet, that's just what SunEdison Inc. (SUNE) has managed to achieve since June 2012; incredibly, the stock is now breaking higher from a significant consolidation pattern, apparently setting its sights on even higher price levels in the weeks ahead. Here's a closer look. |
|
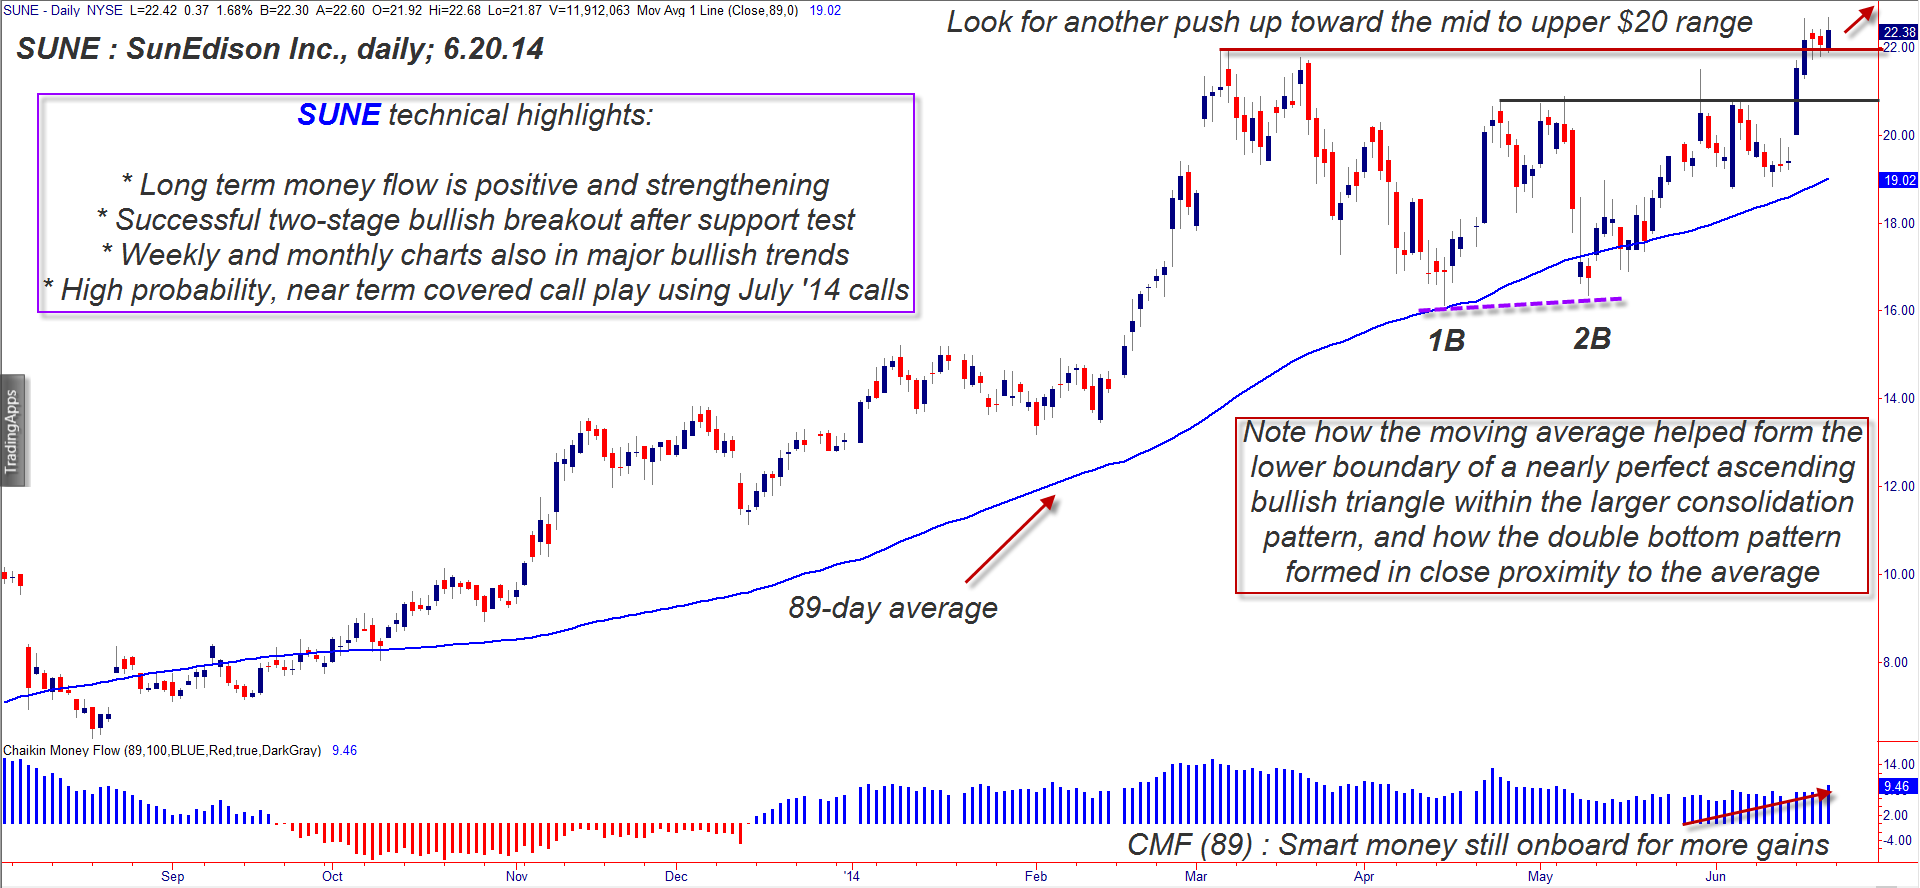
| Figure 1. Daily Chart Of SunEdison Inc. (SUNE). Long-term money flow, trend, price patterns, and breakouts combine to produce a bullish image on this chart. |
| Graphic provided by: TradeStation. |
| |
| Once a stock has rallied by an extensive amount (high percentage gains in a relatively compressed time period), you can typically expect one of two outcomes: 1. A major trend reversal. 2. A period of consolidation that is proportional to the size of the most recent rally phase. In the case of SUNE, it's outcome number 2 that has played out on its daily chart (Figure 1); note that the last trend leg higher went from mid-August '13 to early March '14 (6.5 months) and that the large consolidation pattern took just over three months to complete. The level of price pullback was almost exactly 38.2% and also coincided with a touch of the upwardly sloping 89-day simple moving average (SMA). During the pullback and subsequent consolidation, long-term Chaikin Money Flow (CMF)(89) remained bullish (blue histogram bars) and is now actually strengthening as a new bullish breakout begins to play out. This pattern develops time and again; pullbacks to significant support levels at times of consistently bullish long-term money flow trends are typically great places to stalk new, low-risk long entry setups, and this one in SUNE is no exception: A. The double bottom pattern has the rising 89-period average undergirding both swing lows. B. Long-term money flow remained strong all through the pullback/consolidation. C. The moving average kept rising during the same time period. D. Two significant bullish breakouts have occurred since the double bottom, and these have also re-established the pattern of higher swing highs and higher swing lows in SUNE. Overall, this is morphing into a classic bullish continuation move out of a well-defined consolidation pattern, one that looks to be very attractive to covered call traders. |
|
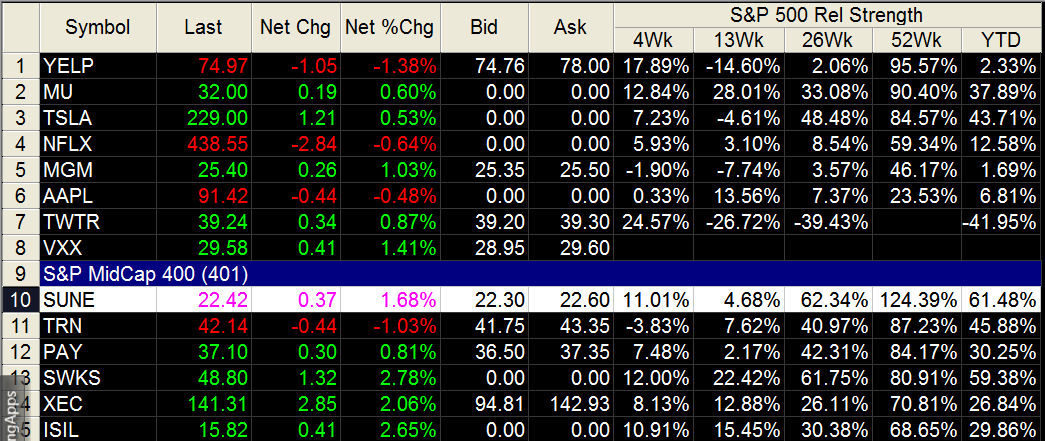
| Figure 2. SUNE has the highest 52-week comparative relative strength rank (vs. the S&P 500 index) of all S&P 400 mid-cap issues. |
| Graphic provided by: TradeStation. |
| Graphic provided by: TradeStation RadarScreen. |
| |
| Selling one July '14 $21.00 SUNE call option for every 100 shares of SUNE acquired looks attractive here; the calls have an open interest of more than 5,000 contracts and a very close bid/ask spread. The $21.00 strike price is nearly $1.50 beneath the current price of the stock, and the rapidly rising 21-day exponential moving average (EMA) is just below the strike. Perhaps the easiest way to manage the position is to use that EMA as your trailing stop for the life of the trade (3.5 weeks); a close below it means you bail out of both sides of the position, and if SUNE remains above it, you simply hold the position through July options expiration. Given the powerful money flow, trend, and pattern breakout characteristics already discussed, this kind of near-term covered call trade looks like a super-high probability play. Keep your account risk at 2% or less and remember to trade wisely until we meet here again. |
Freelance financial markets writer and online publisher of the Trendzetterz.com S&P 500 Weekly Forecast service.
| Title: | Market consultant and writer |
| Company: | Trendzetterz |
| Address: | 81 Hickory Hollow Drive |
| Crossville, TN 38555 | |
| Phone # for sales: | 904-303-4814 |
| Website: | trendzetterz.com |
| E-mail address: | support@trendzetterz.com |
Traders' Resource Links | |
| Trendzetterz has not added any product or service information to TRADERS' RESOURCE. | |
Click here for more information about our publications!
Comments

Request Information From Our Sponsors
- StockCharts.com, Inc.
- Candle Patterns
- Candlestick Charting Explained
- Intermarket Technical Analysis
- John Murphy on Chart Analysis
- John Murphy's Chart Pattern Recognition
- John Murphy's Market Message
- MurphyExplainsMarketAnalysis-Intermarket Analysis
- MurphyExplainsMarketAnalysis-Visual Analysis
- StockCharts.com
- Technical Analysis of the Financial Markets
- The Visual Investor
- VectorVest, Inc.
- Executive Premier Workshop
- One-Day Options Course
- OptionsPro
- Retirement Income Workshop
- Sure-Fire Trading Systems (VectorVest, Inc.)
- Trading as a Business Workshop
- VectorVest 7 EOD
- VectorVest 7 RealTime/IntraDay
- VectorVest AutoTester
- VectorVest Educational Services
- VectorVest OnLine
- VectorVest Options Analyzer
- VectorVest ProGraphics v6.0
- VectorVest ProTrader 7
- VectorVest RealTime Derby Tool
- VectorVest Simulator
- VectorVest Variator
- VectorVest Watchdog