HOT TOPICS LIST
- MACD
- Fibonacci
- RSI
- Gann
- ADXR
- Stochastics
- Volume
- Triangles
- Futures
- Cycles
- Volatility
- ZIGZAG
- MESA
- Retracement
- Aroon
INDICATORS LIST
LIST OF TOPICS
PRINT THIS ARTICLE
by Donald W. Pendergast, Jr.
Shares of Twitter Inc. (TWTR) keep on making new highs within an hourly channel along with increasing money flows.
Position: N/A
Donald W. Pendergast, Jr.
Freelance financial markets writer and online publisher of the Trendzetterz.com S&P 500 Weekly Forecast service.
PRINT THIS ARTICLE
MONEY FLOW INDEX
Twitter - Rising Money Flow Trend
06/24/14 02:09:07 PMby Donald W. Pendergast, Jr.
Shares of Twitter Inc. (TWTR) keep on making new highs within an hourly channel along with increasing money flows.
Position: N/A
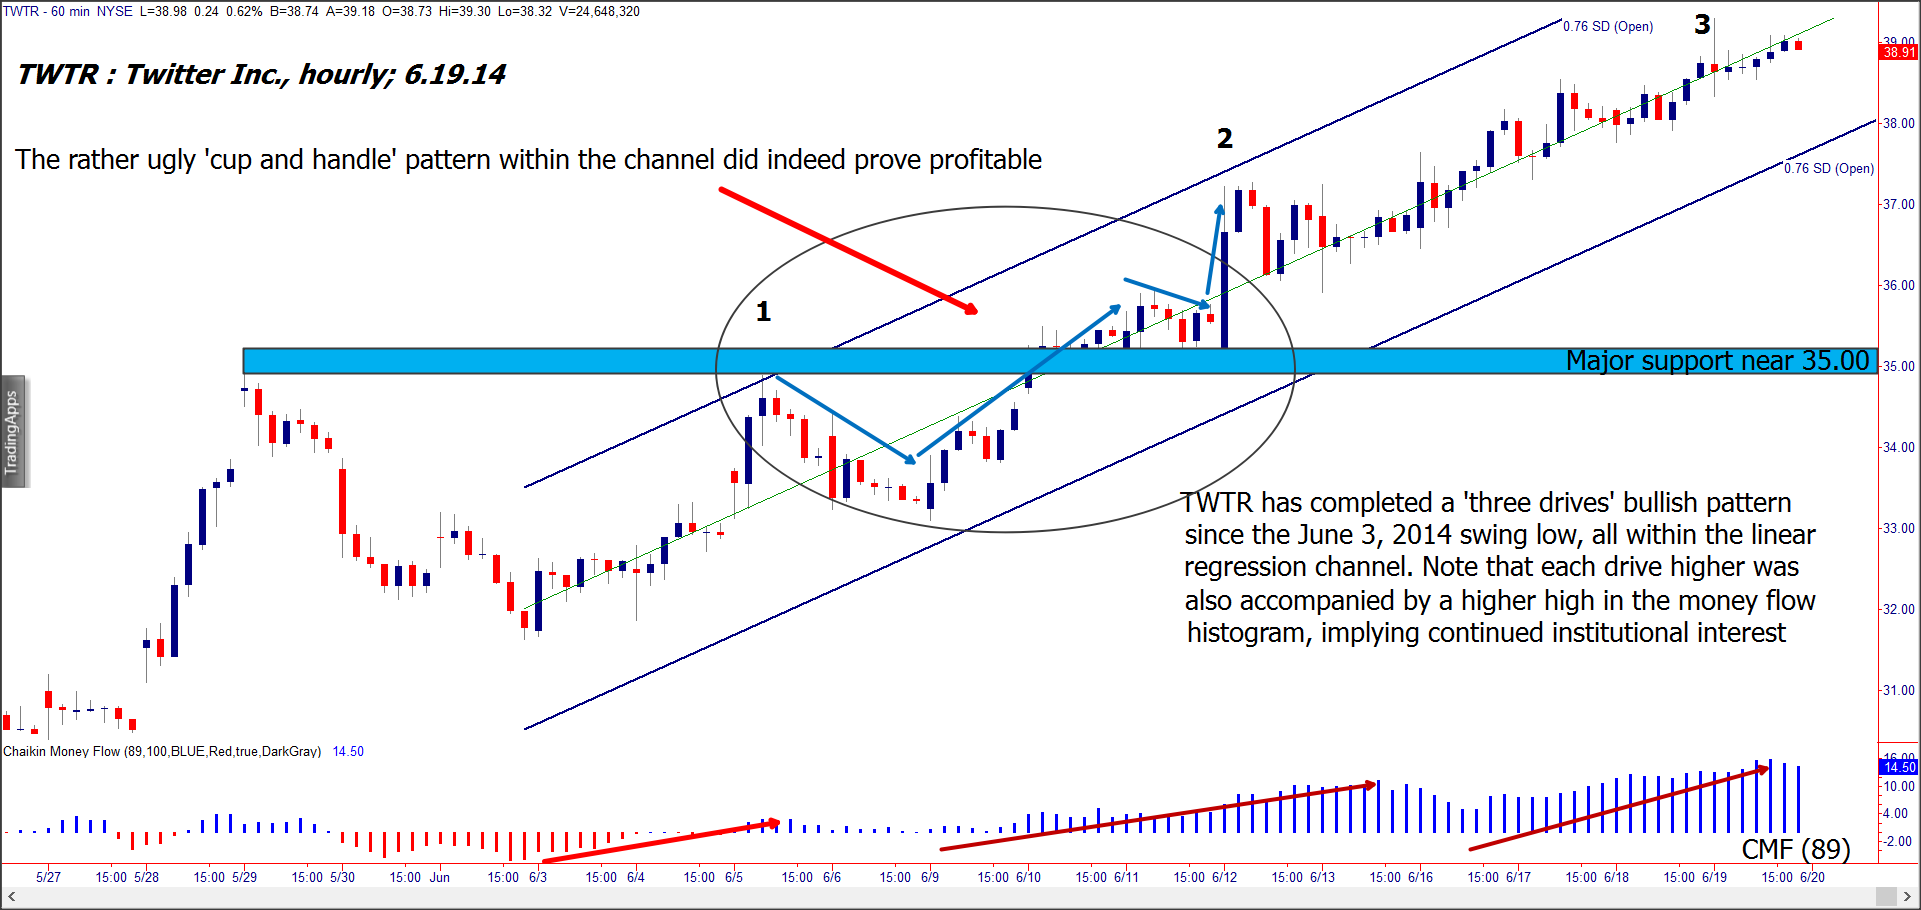
| One of the easiest ways to identify a solid trend in a sufficiently capitalized stock is through the wise use of a linear regression channel; by watching for telltale consolidations and high probability chart formations within the channel, you can better stay on the right side of the dominant trend as new breakouts appear. Here's a look at the bullish hourly channel in shares of Twitter Inc. (TWTR) as seen in Figure 1. |

|
| Figure 1. Twitter (TWTR): Once a linear regression channel can be plotted after seeing significant swing highs/lows form, wise traders will use oscillators and visual pattern recognition to help them spot high probability trade setups. |
| Graphic provided by: TradeStation. |
| |
| Once a stock has put in a significant high or low and has begun to move more aggressively in the direction of such a trend reversal, plotting a linear regression channel can help provide a visual framework that a swing/trend follower can use to great advantage. For example, after TWTR put in a higher swing low on June 3, 2014, the subsequent rally (to point 1) and retracement was enough data to begin the process of tracking the stock's trend progress with a linear regression channel (set to .76 standard deviations). The pullback low was also a great place for an RSI (not shown) oversold buy signal to manifest, which it did. A trader with an eye for pattern recognition could also afterward have identified a lovely — but far from 'perfect' — cup & handle pattern, one that powered TWTR up to swing point 2. Note the key setup features of the cup & handle breakout pattern: 1. The 89-period Chaikin Money flow histogram was trending higher at the time of breakout. 2. The stock had made a successful retest of the major 35.00 support level (blue horizontal area). Ideally, a trader would have a trailing stop (and possibly a profit target) to manage such a long breakout from a cup & handle pattern; in this case the lower boundary of the linear regression channel did a reasonably effective job of keeping a trader in the long position. |

|
| Figure 2. TWTR is easily outperforming the S&P 500 index (.SPX) over the past four weeks, but is severely lagging over the past 13- and 26-week periods and is also way down year-to-date. |
| Graphic provided by: TradeStation. |
| Graphic provided by: TradeStation RadarScreen. |
| |
| Within TWTR's trend channel you can see the 'three drives' — three successive bullish thrusts higher, each of which was accompanied by ever higher long-term money flow histogram peaks. This is a powerful confirmation that the "smart money" still have a lot of confidence in TWTR's ability to trend even higher in the next few sessions and perhaps beyond. While this doesn't guarantee that there won't be another pullback to support, it can help give existing longs in the stock added courage to let the stock run, waiting for their trailing stop to manage the trade rather than their emotions. Should a pullback appear soon, if it is contained by the channel and if the money flow histogram remains positive, look for another high probability long entry setup to manifest for TWTR on its hourly chart. |
| There are many ways to employ price channels in your trading regimen, so begin to work with them on your own charts, looking for the high probability pullbacks, consolidations, and cup & handle formations that regularly take shape within such channels. Trade wisely until we meet here again. |
Freelance financial markets writer and online publisher of the Trendzetterz.com S&P 500 Weekly Forecast service.
| Title: | Market consultant and writer |
| Company: | Trendzetterz |
| Address: | 81 Hickory Hollow Drive |
| Crossville, TN 38555 | |
| Phone # for sales: | 904-303-4814 |
| Website: | trendzetterz.com |
| E-mail address: | support@trendzetterz.com |
Traders' Resource Links | |
| Trendzetterz has not added any product or service information to TRADERS' RESOURCE. | |
Click here for more information about our publications!
PRINT THIS ARTICLE

Request Information From Our Sponsors
- VectorVest, Inc.
- Executive Premier Workshop
- One-Day Options Course
- OptionsPro
- Retirement Income Workshop
- Sure-Fire Trading Systems (VectorVest, Inc.)
- Trading as a Business Workshop
- VectorVest 7 EOD
- VectorVest 7 RealTime/IntraDay
- VectorVest AutoTester
- VectorVest Educational Services
- VectorVest OnLine
- VectorVest Options Analyzer
- VectorVest ProGraphics v6.0
- VectorVest ProTrader 7
- VectorVest RealTime Derby Tool
- VectorVest Simulator
- VectorVest Variator
- VectorVest Watchdog
- StockCharts.com, Inc.
- Candle Patterns
- Candlestick Charting Explained
- Intermarket Technical Analysis
- John Murphy on Chart Analysis
- John Murphy's Chart Pattern Recognition
- John Murphy's Market Message
- MurphyExplainsMarketAnalysis-Intermarket Analysis
- MurphyExplainsMarketAnalysis-Visual Analysis
- StockCharts.com
- Technical Analysis of the Financial Markets
- The Visual Investor
