

HOT TOPICS LIST
- MACD
- Fibonacci
- RSI
- Gann
- ADXR
- Stochastics
- Volume
- Triangles
- Futures
- Cycles
- Volatility
- ZIGZAG
- MESA
- Retracement
- Aroon
INDICATORS LIST
LIST OF TOPICS
PRINT THIS ARTICLE
by Donald W. Pendergast, Jr.
Shares of Halliburton Co. are trending higher in a stable bullish channel, but is there room for yet another surge upward?
Position: N/A
Donald W. Pendergast, Jr.
Freelance financial markets writer and online publisher of the Trendzetterz.com S&P 500 Weekly Forecast service.
PRINT THIS ARTICLE
CHANNEL LINES
HAL: Channelling Still Higher?
06/20/14 04:26:59 PMby Donald W. Pendergast, Jr.
Shares of Halliburton Co. are trending higher in a stable bullish channel, but is there room for yet another surge upward?
Position: N/A
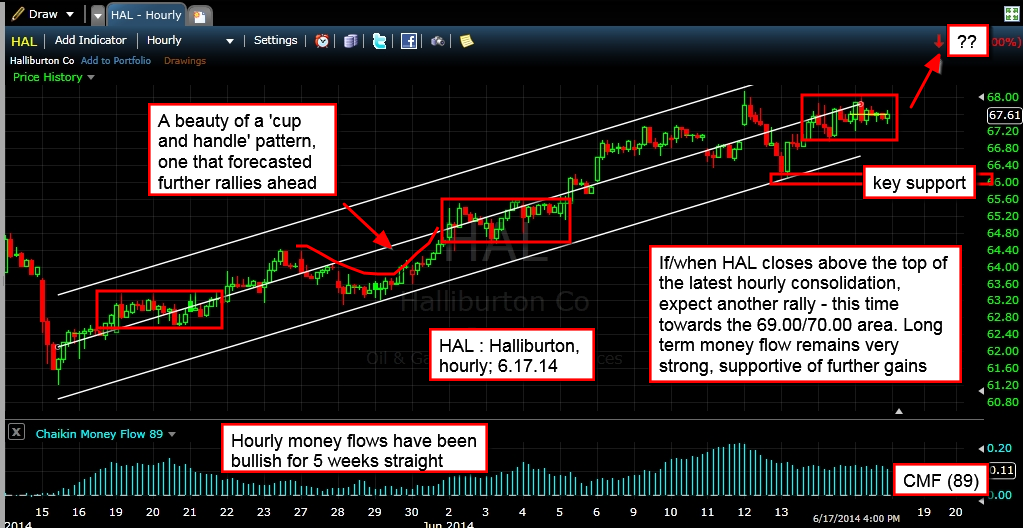
| Since mid-May 2014, shares of Halliburton (HAL) have been enjoying a powerful rally on its hourly/daily charts and are still looking as if they may have even more upside potential left. Here's a look at this trending move along with what to watch for in the next few trading sessions. |
|
| Figure 1. Halliburton (HAL): Learning to identify high probability bullish breakout patterns within a larger uptrend channel pattern is always a good use of a swing/trend trader's time. |
| Graphic provided by: FreeStockCharts.com. |
| |
| Stocks hailing from the oil services industry group can be among the most volatile — and powerfully trending — of all mid/large cap issues in the US market; by learning to use some basic technical analysis tools you may be able to learn how to identify and then stay on the right side of such stocks when they begin to make their moves. As you look at the powerful hourly chart move underway in shares of HAL (Figure 1), you already know that this is a well established uptrend, one that is respecting the Raff regression channel lines that define its key areas of support & resistance. But as you look at the price action within the channel, you can also spot key consolidation/continuation patterns, all of which led to smaller bullish swings within the larger channel pattern rally. Here they are: 1. A rectangle pattern which resolved with a bullish surge. 2. A cup & handle pattern that took two weeks to resolve, also with a solid gain. 3. The latest intra-channel pattern is also a rectangle, one which may also resolve to the upside if HAL can make an hourly close above 68.00. Note the common technical dynamic that links each of these bullish patterns — the 89-period Chaikin Money flow has been well above its zero line the entire time since mid-May 2014. Now, this may not be the basis for the greatest trading system ever devised, but it sure looks like a fantastic jumping off point for aspiring system traders or even for discretionary swing/trend traders: Long system entry parameters: A. The 80- to 110-period Chaikin Money flow histogram is above its zero line. B. The stock is trending higher within a valid linear regression channel. C. Once a valid consolidation or cup & handle pattern forms within the channel, look to take long entries as the stock breaks higher. You could even add other filters to make sure that you are putting some extra 'edges' in your favor: 1. Trade stocks with plenty of average daily volume. 2. Focus on those with upwardly revised earnings growth rate projections. 3. Seek out those stocks that are outperforming the broad market indexes and their industry group peers. 4. Use multiple time frame charts to get a handle on the dominant trend. |
|
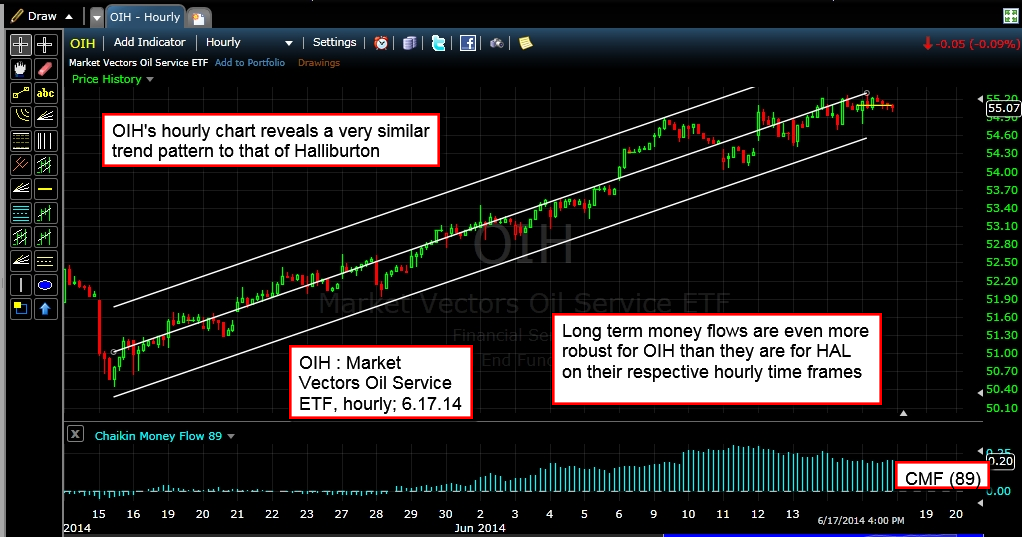
| Figure 2. The Market Vectors Oil Service ETF (OIH) has a similar trending channel pattern as does HAL; note that OIH's money flow histogram is more bullish than HAL's on the hourly time frame chart. |
| Graphic provided by: FreeStockCharts.com. |
| |
| Note that OIH (Market Vectors Oil Services ETF) is also manifesting similar trending behavior and that its long-term money flow histogram is even more bullish than that of HAL on the hourly time frame (Figure 2). For as long as either of these securities continue to break higher from valid consolidation patterns within their larger channels, the line of least resistance must be presumed to be toward higher prices. Obviously, at some point this uptrend will cease, so you may want to use less account risk on trade entries that occur after numerous breakout patterns have already come to pass. Trade wisely until we meet here again. |
Freelance financial markets writer and online publisher of the Trendzetterz.com S&P 500 Weekly Forecast service.
| Title: | Market consultant and writer |
| Company: | Trendzetterz |
| Address: | 81 Hickory Hollow Drive |
| Crossville, TN 38555 | |
| Phone # for sales: | 904-303-4814 |
| Website: | trendzetterz.com |
| E-mail address: | support@trendzetterz.com |
Traders' Resource Links | |
| Trendzetterz has not added any product or service information to TRADERS' RESOURCE. | |
Click here for more information about our publications!
PRINT THIS ARTICLE

Request Information From Our Sponsors
- StockCharts.com, Inc.
- Candle Patterns
- Candlestick Charting Explained
- Intermarket Technical Analysis
- John Murphy on Chart Analysis
- John Murphy's Chart Pattern Recognition
- John Murphy's Market Message
- MurphyExplainsMarketAnalysis-Intermarket Analysis
- MurphyExplainsMarketAnalysis-Visual Analysis
- StockCharts.com
- Technical Analysis of the Financial Markets
- The Visual Investor
- VectorVest, Inc.
- Executive Premier Workshop
- One-Day Options Course
- OptionsPro
- Retirement Income Workshop
- Sure-Fire Trading Systems (VectorVest, Inc.)
- Trading as a Business Workshop
- VectorVest 7 EOD
- VectorVest 7 RealTime/IntraDay
- VectorVest AutoTester
- VectorVest Educational Services
- VectorVest OnLine
- VectorVest Options Analyzer
- VectorVest ProGraphics v6.0
- VectorVest ProTrader 7
- VectorVest RealTime Derby Tool
- VectorVest Simulator
- VectorVest Variator
- VectorVest Watchdog